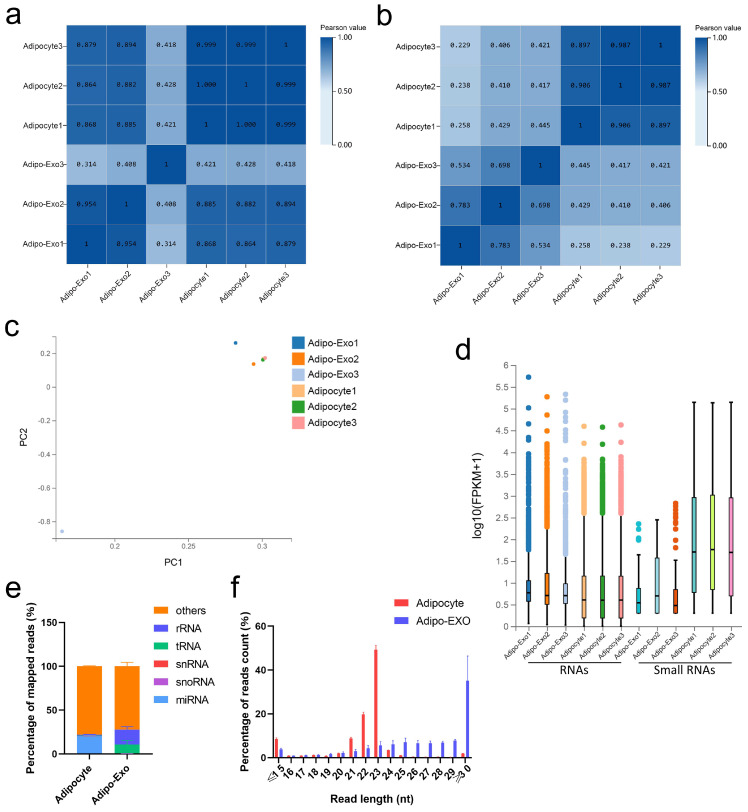
Figure 2.
Analysis of the sequencing data. (a,b) Heat maps showing Pearson correlations of RNA (a) and small RNA (b) from adipocyte-derived exosomes and adipocytes. (c) Principal component analysis (PCA) of all normalized RNA sequencing data. (d) Box plot of detected RNAs. (e) Percentage of different classes of small RNAs. (f) Length and frequency distributions of total small RNAs. Error bars indicate the SEM.

