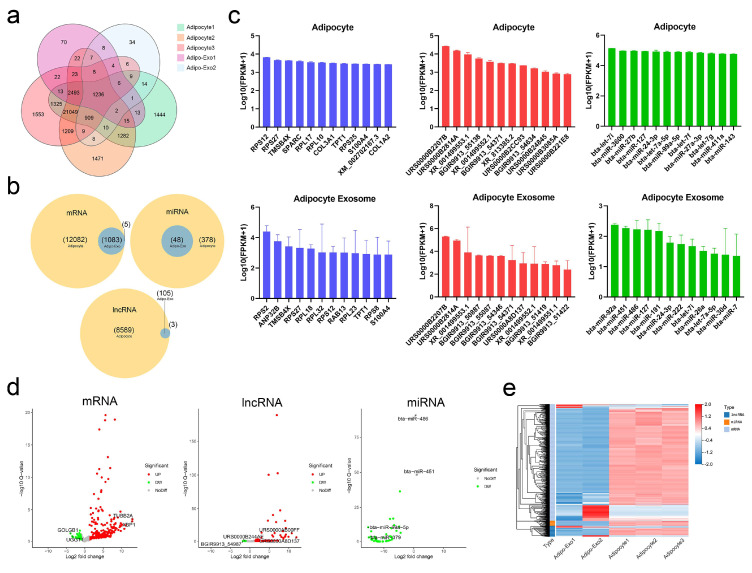
Figure 3.
Profiles of exosomal and nonexosomal RNAs. (a,b) Venn diagrams showing the profile of total RNAs (a) and three types of RNA (b) overlaps between adipocytes and released exosomes. (c) Histograms of the 12 most abundant mRNAs (blue), lncRNAs (red), and miRNAs (green) from adipocytes and released exosomes. (d) Volcano maps of differentially expressed exosomal mRNAs, lncRNAs, and miRNAs according to the criteria of fold change ≥ 2 between parental adipocytes and exosomes. (e) Heatmap of differentially expressed RNAs between parental adipocytes and exosomes.

