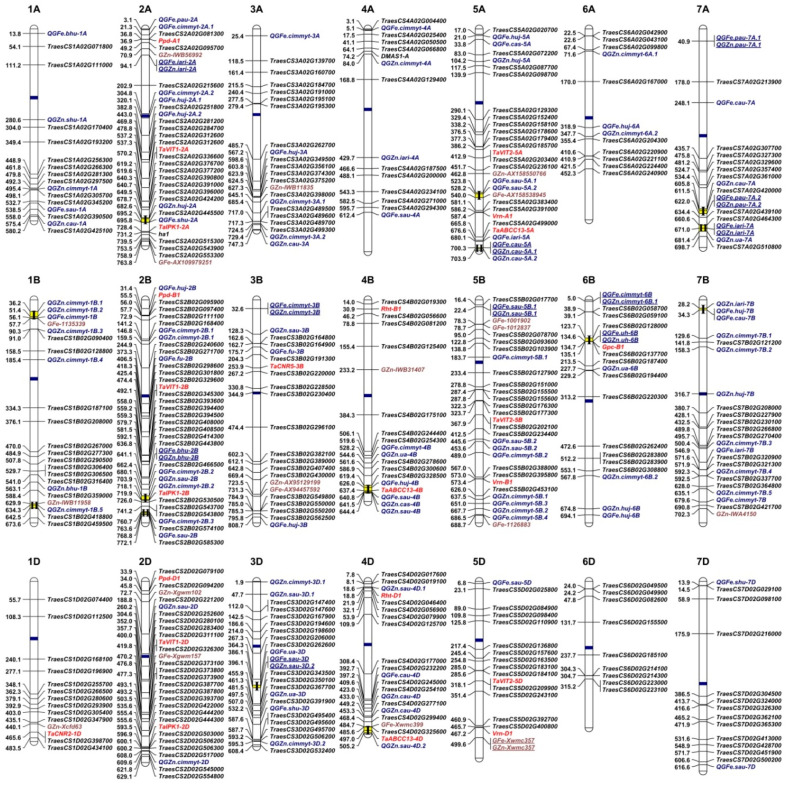
Figure 1.
Landscape of genetic architecture underlying Fe- and Zn-related traits in wheat. 1A–7A, 1B–7B, and 1D–7D indicate the numbers of chromosomes in wheat. Genetic loci for Fe and Zn traits identified from wheat orthologs of Arabidopsis and rice genes, QTL mapping, association studies, and cloned wheat genes are displayed in black, blue, brown, and red, respectively. Blue and yellow bars within chromosomes indicate the locations of centromeres and QTL-rich clusters. “GFe” and “GZn” indicate grain Fe- and Zn-related loci, respectively. QTL associated with both Fe and Zn are underlined.

