Figure 3.
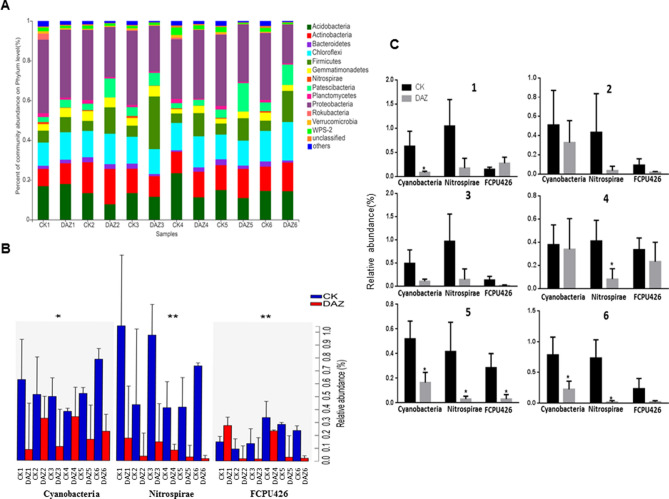
Dynamic changes of dominant bacterial community analyses on phylum level. (A) Community bar plot analysis of soil bacterial community abundance in different sampling times on phylum level. (B) Kruskal–Wallis H test was used to test the significance of the dynamic changes of bacterial community relative abundance at different sampling times on phylum level. (C) Student’s t-test bar plot showed significant differences of the main bacterial phyla between treatment and CK. The X-axis represents the bacterial phylum, the Y-axis represents its average relative abundance. DAZ dazomet treatment, CK control. Numbers after letters indicate different sampling times. 1 (March 6th, 2018, before dazomet treatment), 2 (April 24th, 2018, watermelon seedling stage), 3 (May 3rd, 2018, Fusarium wilt symptom appearance), 4 (March 6th, 2019, before dazomet treatment), 5 (April 22th, 2019, watermelon seedling stage), 6 (April 29th, 2019, Fusarium wilt symptom appearance). Data are expressed as the means ± SD (n = 3). * 0.01 < P ≤ 0.05, ** 0.001 < P ≤ 0.01.

