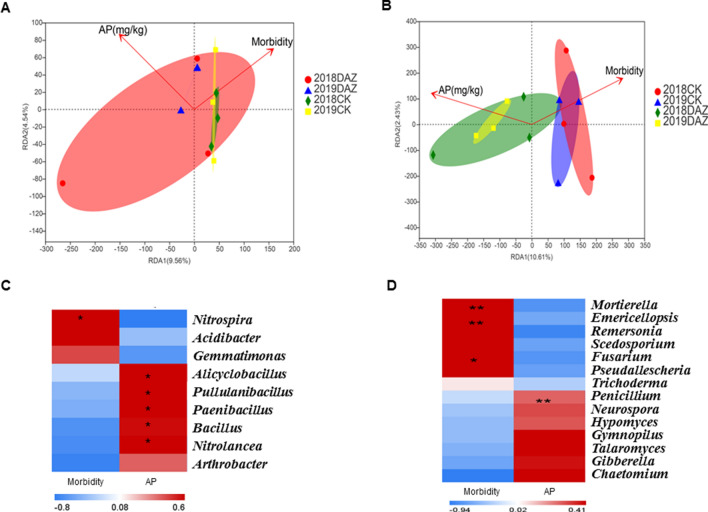
Figure 8.
Correlation analysis of environmental factors. (A) RDA analysis on bacterial genus level. (B) RDA analysis on fungal genera level. (C) Spearman Correlation Heatmap of bacterial genera. (D) Spearman Correlation Heatmap of fungal genus. AP Available soil phosphorus. Red color represents highly positively correlated values; Blue color represents negatively correlated values. Means ± SD (n = 3). * 0.01 < P ≤ 0.05, ** 0.001 < P ≤ 0.01.

