Figure 2.
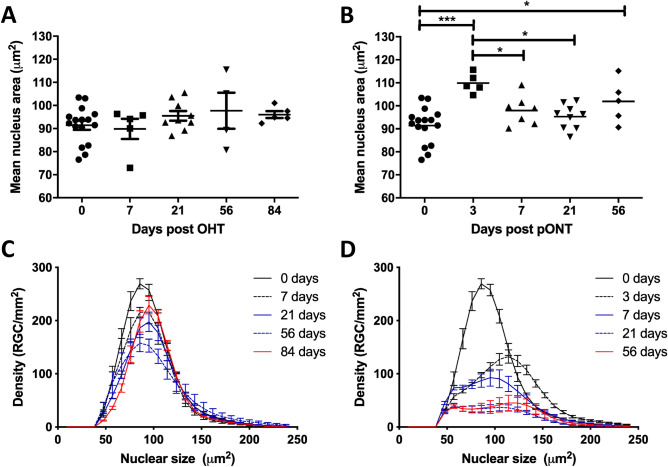
The distribution of RGC nucleus area changes over the course of the OHT (A, C) and pONT (B, D) models. (A) Average RGC nucleus area does not significantly change over the course of the OHT model. (B) However, a significant increase in nuclear area is observed 3 days after pONT induction, followed by a reduction in area from 7 days post pONT (One-way ANOVA, Tukey post-hoc test, *p < 0.05, ***p < 0.001). Data points represent individual animals, to illustrate inter-animal variability. (C, D) Overall, the RGC density declines and the distribution of RGC density by nucleus area shifts to the right over the course of the (C) OHT model and (D) pONT models, although this trend is more subtle in the OHT model.

