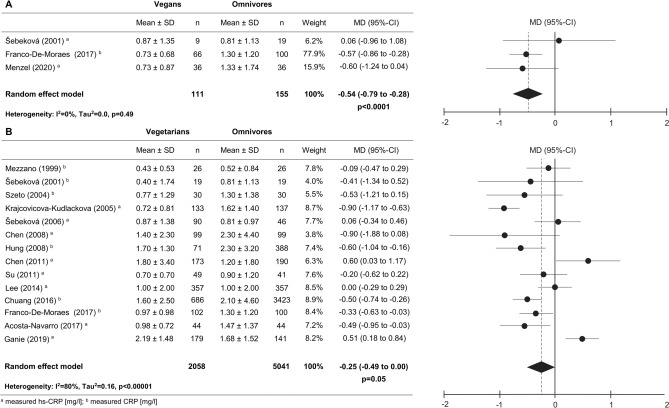
Figure 2.
Forest plots of the effect of a vegan and vegetarian diet on CRP concentrations compared to omnivorous diet in apparently healthy participants. Forest plot showing the overall effect of a vegan diet (A) or a vegetarian diet (B) on CRP concentrations compared to omnivorous diet in apparently healthy participants. Results are presented as mean difference (MD) (95%-CI). The study-specific MD and 95%-CI are represented by the black dot and horizontal line, respectively. The center of the diamond and the vertical dashed line represent the overall effect size of all studies; the width of the diamond represents the overall pooled 95%-CI.

