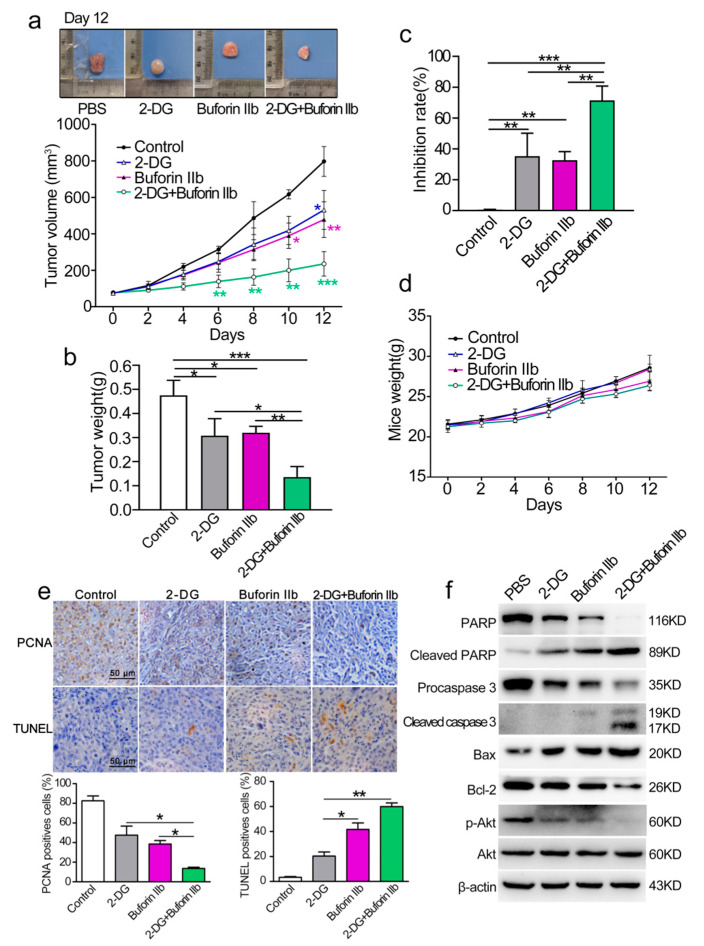
Figure 7.
Effect of 2-DG combined with buforin IIb on DU145 xenograft tumors. (a) Tumor growth curves over time. The difference comparison was conducted between different treatment groups and PBS control group. (b) On day 12, tumors were carefully excised and tumor weight was measured. (c) Comparison of inhibition rate of tumor growth in different treatment groups. (d) Weight curves of mice over time. (e) Paraffin sections were examined by immunohistochemical staining using anti-PCNA antibody and TUNEL staining. Representative images from each group are shown. (f) Tumor tissues were crushed and lysed with RIPA lysis buffer, and the supernatants were collected for western blot analysis using the indicated antibodies. Similar results were obtained in at least three independent experiments. * p < 0.05, ** p < 0.01, *** p < 0.001.

