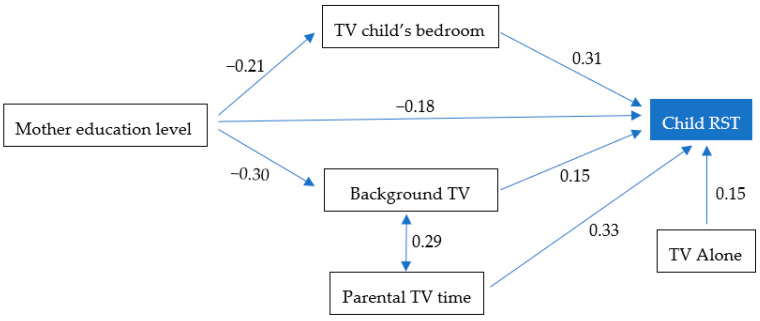
Figure 2.
Final Path Model for the younger group (2–6 year-old) with standardized regression coefficients and correlations between variables. Proportion of variance explained: 38%. Fitting parameters: χ2 = 8.175, df = 6, p < 0.01; RMSEA < 0.01; CFI = 1; TLI = 0.95. TV, television; RST, recreational screen time; RMSEA, root means square error of approximation; CFI, comparative fit index; TLI, Tacker-Lewis index.

