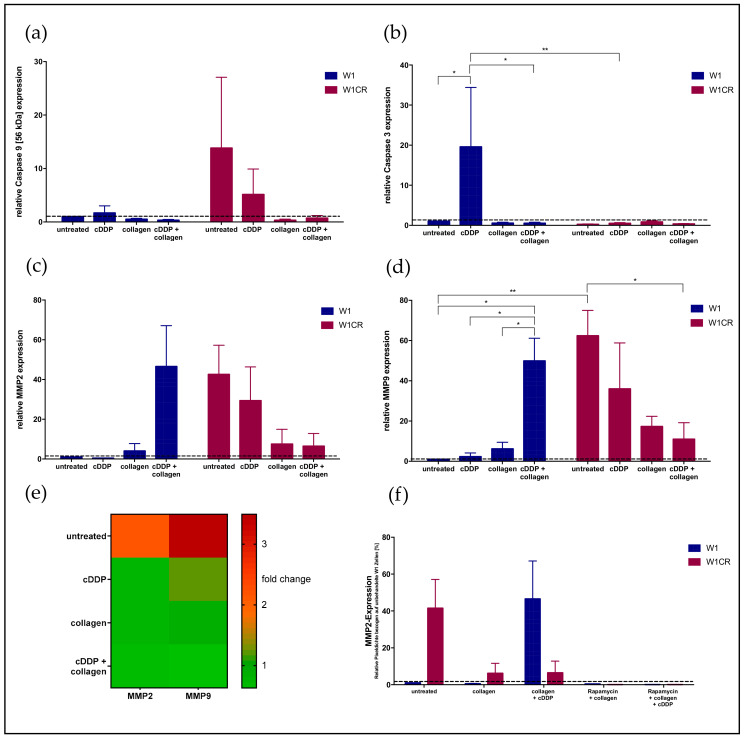
Figure 6.
Protein levels of caspase 9 (a) and the downstream effector caspase 3 (b) in W1 and W1CR cells upon the indicated treatment. Protein levels of MMP2 (c) and MMP9 (d) in W1 and W1CR cells reflected by the corresponding mRNA levels shown as comparison of W1CR cells versus W1 cells (e). (f) MMP2 expression levels in W1 and W1CR cells and the impact of a pretreatment with rapamycin thereon. Data are means of at least n = 3 (±SEM), asterisks indicate statistical significance: *p < 0.05; **p < 0.01.

