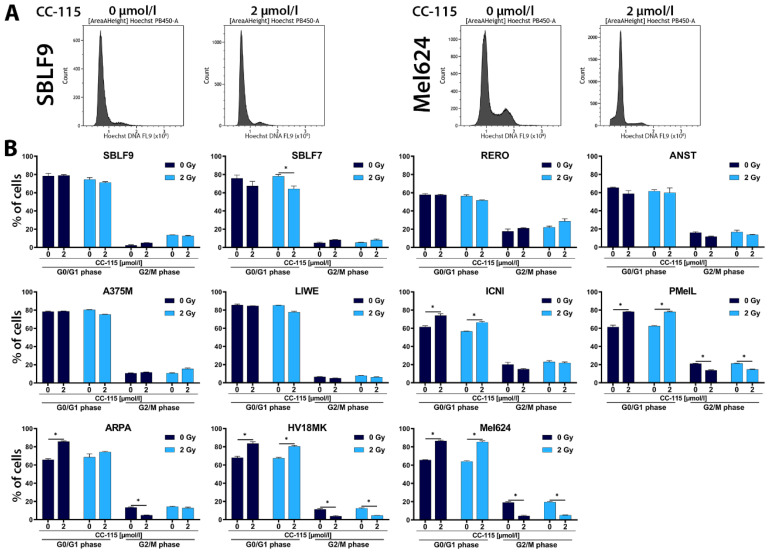
Figure 3.
Cell cycle distribution under CC-115 treatment with/without IR. (A) Flow cytometry was used for cell cycle analysis by Hoechst staining. Examples of representative histograms of Hoechst stained DNA distribution for control and 2 µmol/L CC-115 are shown, left: healthy-donor skin fibroblasts (SBLF9), right: melanoma cells (Mel624). (B) Graphs show the percentage of cells in G0/G1 phase (left columns) or G2/M phase (right columns) for 0 and 2 µmol/L CC-115 with/without IR (2 Gy) in skin fibroblasts (SBLF9, SBLF7) and melanoma cells (RERO, ANST, A375M, LIWE, ICNI, PMelL, ARPA, HV18MK, Mel624). Each value represents mean ± SD (n = 3). Significance was determined by one-tailed Mann-Whitney U test * p ≤ 0.05.

