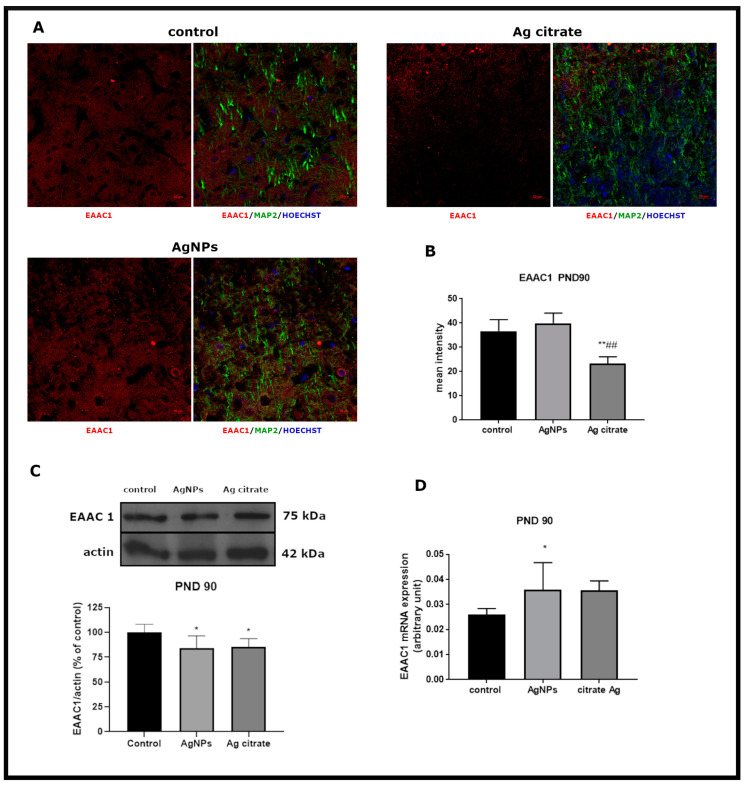
Figure 3.
Late effects of a low dose of AgNPs/Ag+ on the expression of neuronal glutamate transporter EAAC1 in the brain of exposed rats (PND 90). (A) Representative confocal images of EAAC1 immunofluorescence in brain sections from the control and AgNP- and Ag citrate-treated rats. Double immunostaining was performed with anti-EAAC1(red) and anti-MAP-2 (green) antibodies. Nuclei were labeled with Hoechst (blue). Scale bars represent 20 μm. (B) The mean intensity of the fluorescence signal. Data are presented as means ± SD. ** p < 0.01 significantly different vs. control; ## p < 0.01 significantly different vs. AgNP-treated rats; n = 9–12 sections from three distinct brains in each group. (C) Relative expression of EAAC1 protein in the brain of the control and AgNP- and Ag citrate-treated rats. Representative immunoblot and graph illustrating the mean results of densitometric measurements of five independent immunoblots performed using four distinct animals per group. The relative density was measured against β-actin as an internal standard and expressed as a percentage of control. * p < 0.05 significantly different vs. control. (D) Expression of EAAC1mRNA in the brain of the control and AgNP- and Ag citrate-treated rats. The mRNA levels were determined by quantitative real-time PCR and normalized against actin. The graph indicates the results expressed as arbitrary units from four independent experiments. * p < 0.05 significantly different vs. control. One-way ANOVA followed by Tukey’s multiple comparison test was used for statistical analysis.

