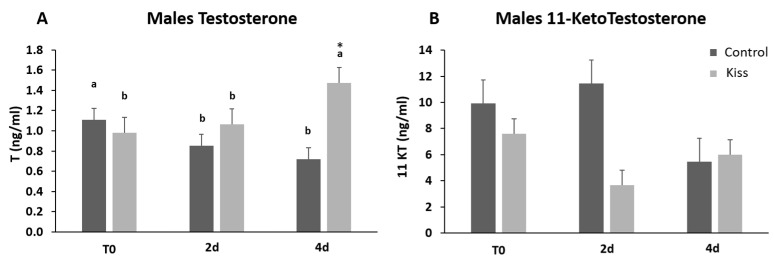
Figure 6.
Sexual steroids plasma levels in ng/mL (mean ± SEM) from Senegalese sole males treated with kisspeptin hormone (n = 17) and control (n = 13). (A) Testosterone and (B) 11-Ketotestosterone levels before (T0) and after (2 h: 2-h; 4 h: 4-h; 2 d: 2-days; 4 d: 4-days) the kisspeptin injection. The asterisk (*) denotes significant differences between experimental groups at each sampling point (Student’s t-test, p < 0.05); different letters indicate significant differences among sampling points within each experimental group (one-way ANOVA, Dunnett’s test, p < 0.05, T0 considered as control point).

