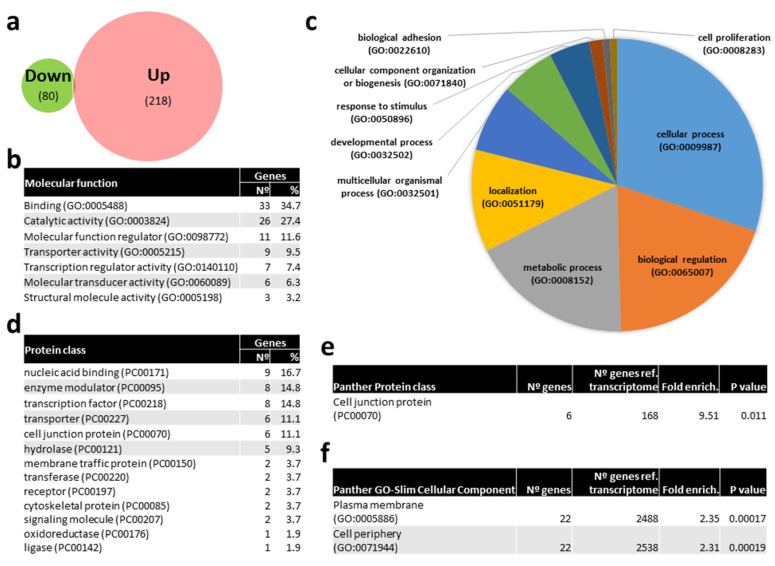
Figure 8.
Venn diagram of predicted mRNA targets of miRNAs differentially expressed (DE) with kisspeptin treatment in blood plasma of Senegalese sole females and gene ontology (GO) analysis. (a) Venn diagram with the number of predicted mRNAs targeted by DE miRNAs. (b) List of GO molecular functions represented by predicted mRNAs targeted by DE miRNAs. (c) Pie chart of GO biological process of predicted mRNAs targeted by DE miRNAs. (d) List of GO Protein classes represented by predicted mRNAs targeted by DE miRNAs. (f) List of overrepresented Panther Protein classes (e) and GO-Slim Cellular Component of predicted mRNAs targeted by DE miRNAs showing the number of genes, the fold enrichment and the p value.

