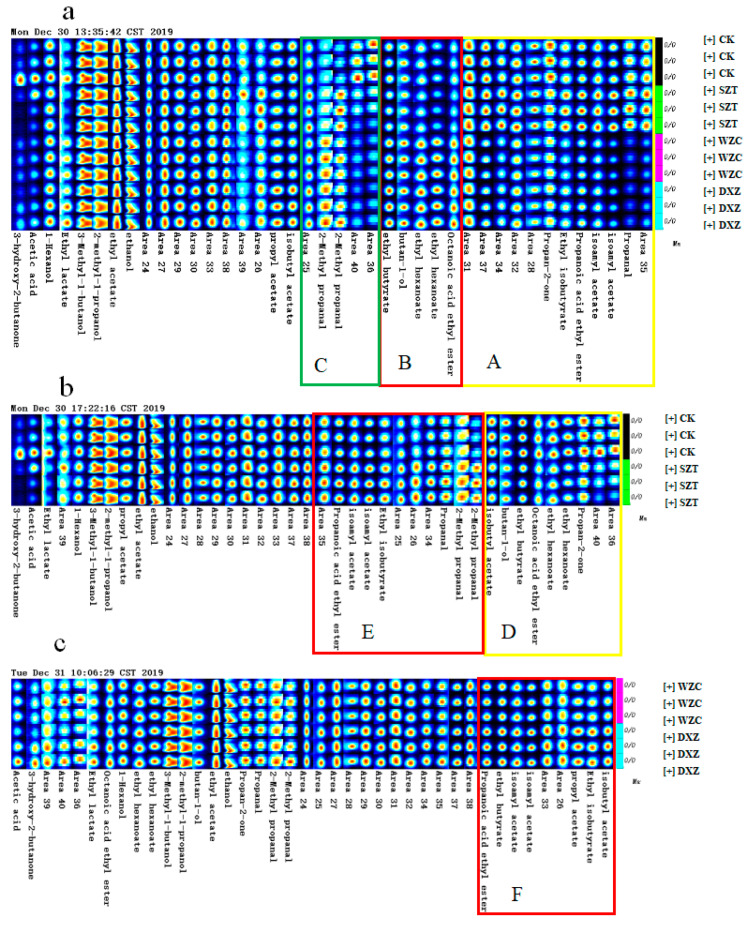
Figure 3.
Analyzed by GC-IMS. (a) Comparison of gallery plot in all wine samples (CK, SZT, WZC, and DXZ wine samples). (b) Comparison of gallery plot between the control (CK) and triadimefon-treated (SZT) wine groups. (c) Comparison of gallery plot between the tebuconazole-treated (WZC) and paclobutrazol-treated (DXZ) wine groups. A, B, C, D, E, F represent regions where volatile compounds differ significantly.

