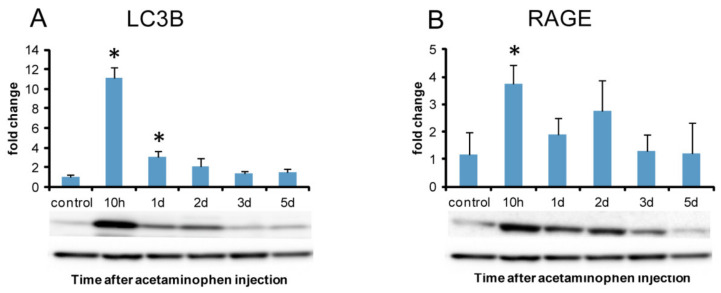
Figure 13.
Western blotting analysis of LC3B and RAGE in APAP-induced rat hepatotoxicity. Significantly increased expression of LC3B protein is seen at hour 10 and day 1 (A) with a peak on day 10. RAGE protein expression is significantly increased at hour 10 (B). A representative band is shown at each examination point (A and B). GAPDH was used as the loading control (lower panel). Dunnett’s test; *, significantly different from controls at p < 0.05. Bar represents the mean ± SD. RAGE, receptors for advanced glycation end products.

