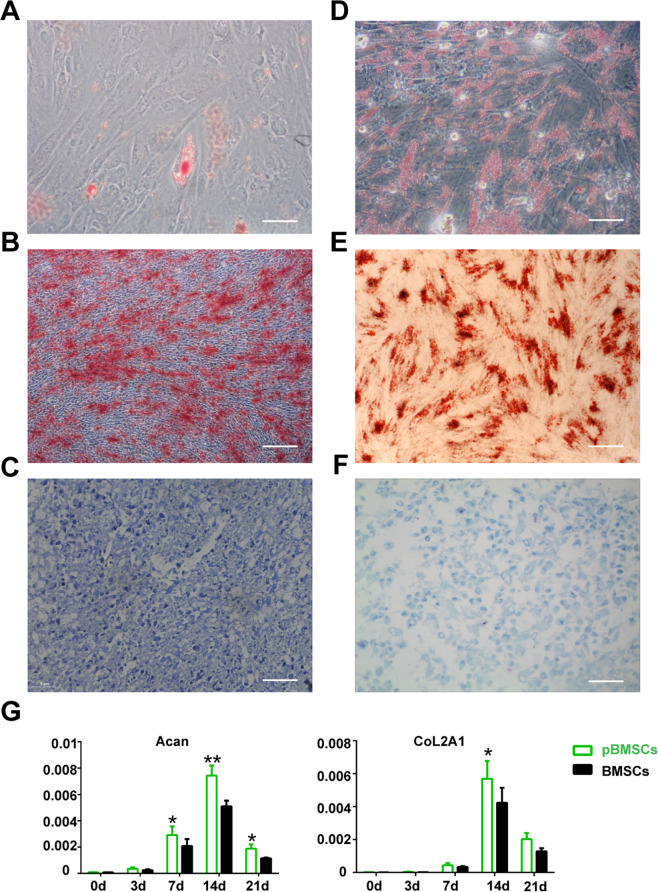
Fig. 2. The potential of the three-dimensional differentiation of the pBMSCs.
A–C pBMSCs were purified from polydactyly bone marrow and then induced into adipose, osteoblast, and chondroblast cells. Scale bars, 40 μm. D–F BMSCs were purified from donor bone marrow and then induced into adipose, osteoblast, and chondroblast cells. Scale bars, 40 μm. G Real-time PCR analysis of Acan and CoL2A1 mRNA expression in the pBMSCs at different time points and BMSCs after induction into chondroblast cells.

