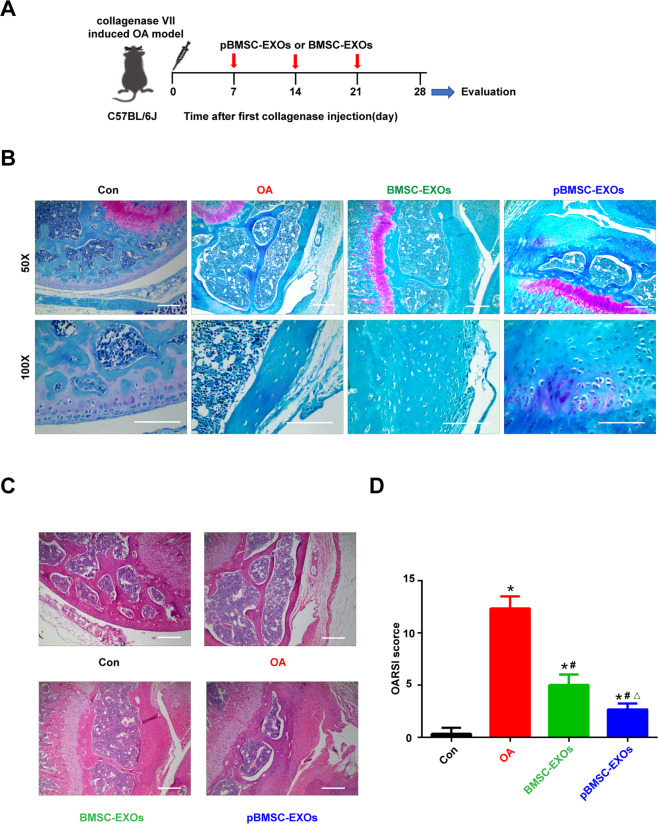
Fig. 6. Exosomes secreted by the pBMSCs for the treatment of osteoarthritis.
A Flowchart of the in vivo experiment. B Safranin O/fast green staining. Scale bars, 100 μm. C H&E staining. Scale bars, 100 μm. D OARSI scores of the OA, BMSC-EXO, and pBMSC-EXO groups were significantly higher than those of the control (Con) group, **P < 0.01. The scores of the BMSC-EXO and pBMSC-EXO groups were significantly lower than those of the OA group, ##P < 0.01. Furthermore, there was a significant difference between the BMSC-EXO and pBMSC-EXO groups, △P < 0.05.

