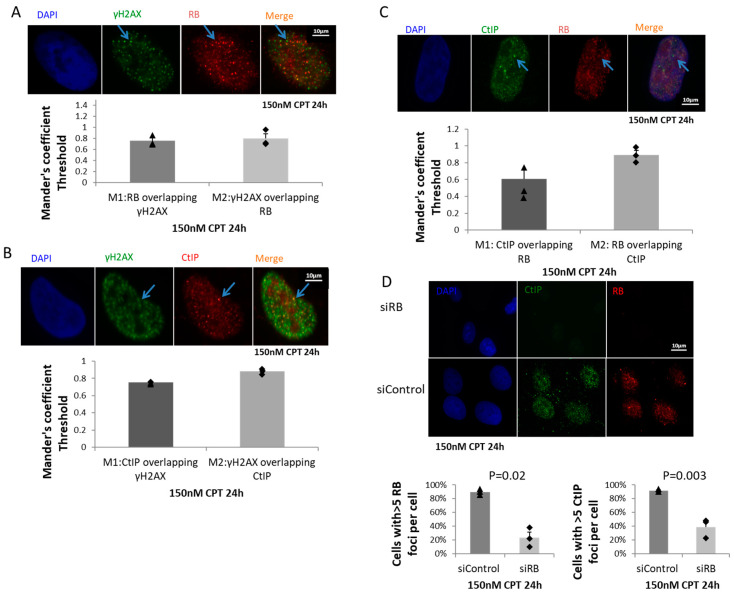
Figure 2.
RB co-localized with CtIP at DSBs and regulated CtIP foci formation. (A): RB and γH2AX were co-stained by immunofluorescence after treating cells with 150 nM CPT for 24 h. Scale bar is 10 μm. Co-localization of RB and γH2AX was quantified by ImageJ software. In total, 115 cells were counted. Manders’ coefficients showed the percentages of co-localization of RB and γH2AX. Experiments were repeated three times. Bar chart shows the mean values from three experiments. Error bars show the standard error of the mean. Blue arrows indicate an example of RB and γH2AX co-localization. (B): CtIP and γH2AX were co-stained by immunofluorescence after treating cells with 150 nM CPT for 24 h. Scale bar is 10 μm. Co-localization of CtIP and γH2AX was quantified by ImageJ software. In total 183 cells were counted. Manders’ coefficients showed the percentages of co-localization of CtIP and γH2AX. Experiments were repeated three times. Bar chart shows the mean values from three experiments. Error bars show the standard error of the mean. Blue arrows indicate an example of CtIP and γH2AX co-localization. (C): RB and CtIP were co-stained by immunofluorescence after treating cells with 150 nM CPT for 24 h. Scale bar is 10 μm. Co-localization of RB and CtIP was quantified by ImageJ software. In total 102 cells were counted. Manders’ coefficients showed the percentages of co-localization of RB and CtIP. Experiments were repeated three times. Bar chart shows the mean values from three experiments. Error bars show the standard error of the mean. Blue arrows indicate an example of RB and CtIP co-localization. (D): RB and CtIP were co-stained in both RB knocked-down cells and control treated cells. Experiments were repeated three times. In total 102 cells in the siControl, and 138 cells in the siRB, groups were counted. Bar charts show the mean value from three experiments. Error bars show the standard error of the mean. An unpaired T-test was used for statistical analysis.

