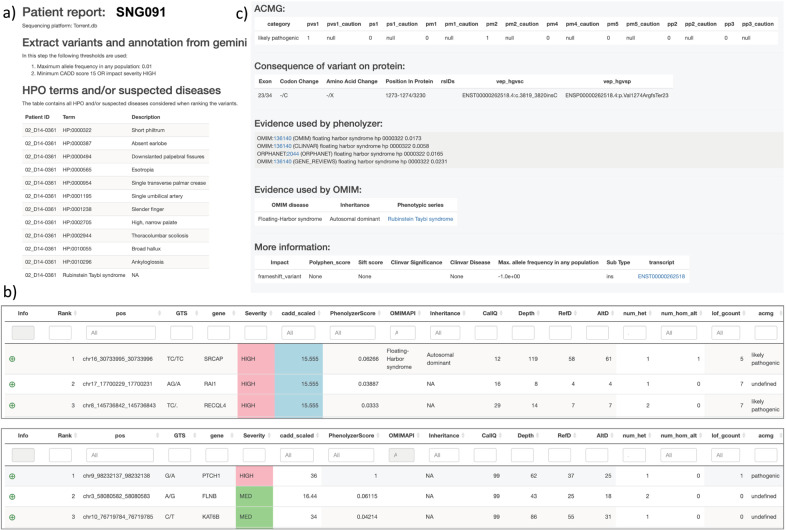
Fig. 1. Screenshots for sections of the patient reports output by the diagnostic pipeline.
a shows the part of the .html file that provides input information including sequencing platform and HPO and OMIM disease terms; b shows the top three ranked candidates from two reports where the top candidate ranking is based on OMIM (upper panel) and Phenolyzer score (lower panel). Further columns to the right of the Phenolyzer score provide information from the OMIM API, mode of inheritance, CallQ, total read depth, read depth for the reference allele, read depth for the alternative allele, number of heterozygotes in the cohort, number of homozygotes in the cohort, total number of HIGH impact variants in the given gene across the cohort and ACMG classification. The patient report variant table can be filtered on one or more columns, as desired by the clinician or researcher. Clicking on the green dot to the left of the rank 1 variant in the upper panel shows c the evidence used to diagnose this particular variant as Floating Harbor Syndrome based on the OMIM Phenotypic Series for Rubinstein Taybi Syndrome.

