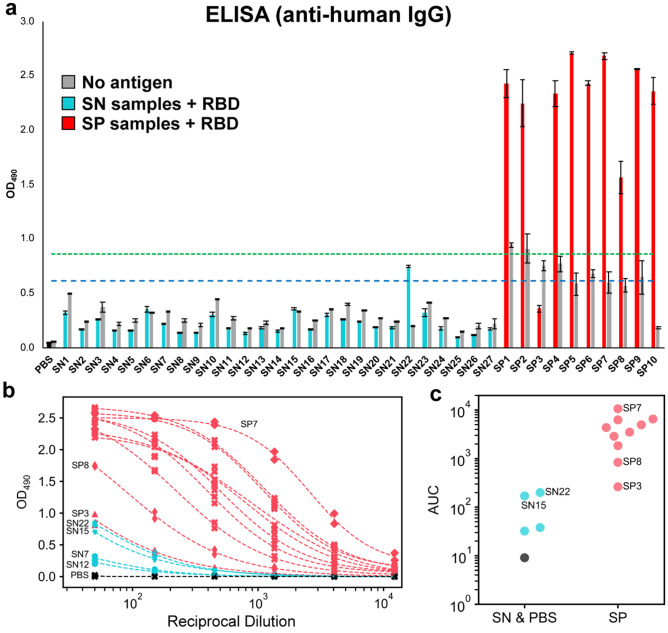
Figure 1.
ELISA evaluation of SARS-CoV-2 spike RBD reactivity of pre-pandemic and convalescent plasma. (a) Single-dilution ELISA to evaluate the presence of RBD-reactive human IgG in pre-pandemic seronegative (SN, cyan) and convalescent seropositive (SP, red) samples compared to no-antigen controls (grey). The assays were performed with plasma at a 1:50 dilution. Samples were evaluated in biological duplicates and error bars represent one standard deviation from the mean. Blue and green dashed lines represent the mean of seronegative samples plus 3 and 5 standard deviations, respectively. (b) Dilution series ELISA was performed to quantitate RBD-reactive human IgG in plasma. Samples were evaluated in biological duplicates. Dashed curves represent fit lines from a four-parameter logistic regression applied over each series. (c) Data from (b) plotted as area-under-the-curve (AUC).

