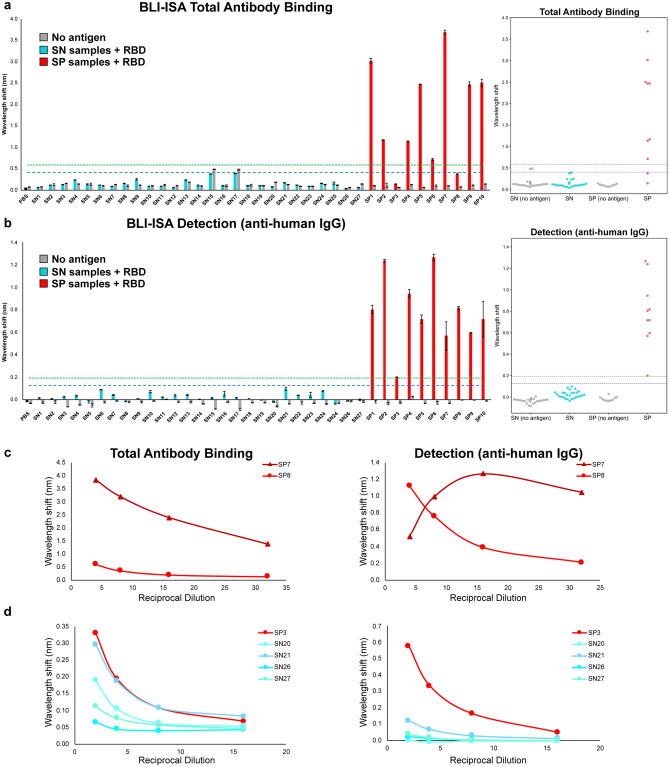
Figure 3.
BLI-ISA evaluation of SARS-CoV-2 spike RBD reactivity of pre-pandemic and convalescent plasma. (a,b) Single-dilution BLI-ISA to evaluate the presence of RBD-reactive human antibodies in the pre-pandemic seronegative (SN, cyan) and convalescent seropositive (SP, red) samples compared to no-antigen controls (grey). The assays were performed with plasma at a 1:8 dilution. Bars and dots represent the mean of biological duplicates, and error bars represent one standard deviation from the mean. Blue and green dashed lines represent the mean of seronegative samples plus 3 and 5 standard deviations, respectively. (a) The Total Antibody Binding signal is measured when RBD-biotin-loaded SA biosensors are dipped into plasma samples. (b) The Detection signal is measured when RBD-biotin-loaded SA biosensors that had been dipped into plasma are subsequently dipped into colloidal gold-conjugated anti-human IgG. (c) Dilution series BLI-ISA from representative strong (SP7) and moderate (SP8) seropositive samples. (d) Dilution series BLI-ISA from the weakest seropositive sample (SP3) compared to seronegative plasma samples.

