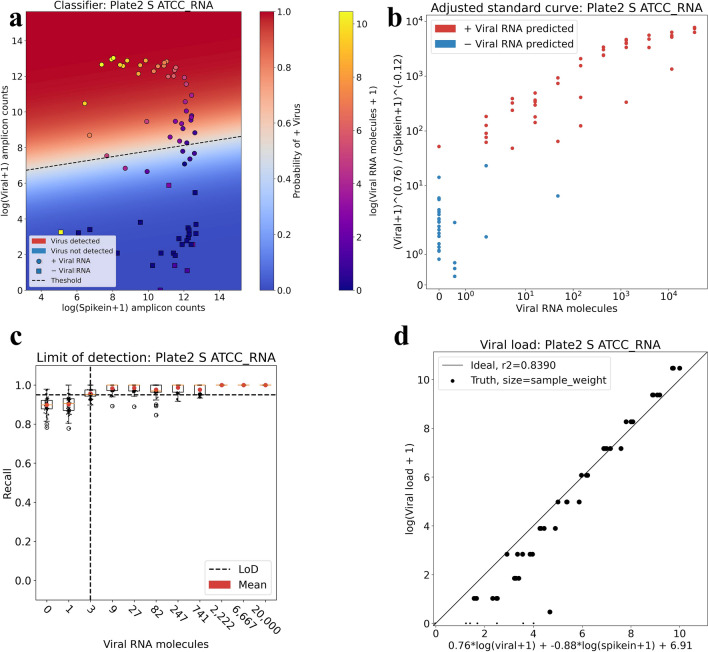
Figure 2.
Sample classification, viral load prediction and limit of detection. (a) Positive and negative samples from the Plate 2 S ATCC RNA experiment can be effectively separated using logistic regression. Points correspond to samples and are colored by the known amount of viral RNA per sample. The probability of each sample having a non-zero amount of viral RNA is given by the logistic function and is painted as orthogonal to the logistic regression boundary. The shape of the point indicates whether the sample was predicted to be positive for viral RNA (circle) or negative (square). (b) The standard curve measuring spike-in and virus versus the known amount of viral RNA per sample with optimal exponential coefficients determined by logistic regression; samples are colored by their predicted classification. (c) The limit of detection as estimated from 99 rounds of split/test and logistic regression to classify samples with a non-zero amount of viral RNA. The limit of detection is defined as the number of RNA molecules for which the recall is greater than 19/20 (= 0.95) (d) The viral load per sample can be predicted with a weighted linear regression using the log counts from each gene. Each point is a sample, with perfect predictions lying on the diagonal line. The size of the points represents their weight, with points weighted so that each titer is represented with equal weight. The code to reproduce each figure is here: https://github.com/pachterlab/BLCSBGLKP_2020/blob/master/notebooks/diagnostic.ipynb (a) and (b), https://github.com/pachterlab/BLCSBGLKP_2020/blob/master/notebooks/lod_fda.ipynb (c), https://github.com/pachterlab/BLCSBGLKP_2020/blob/master/notebooks/viral_load.ipynb (d).

