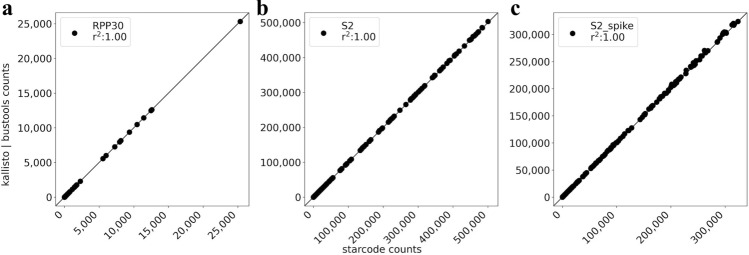
Figure 3.
Orthogonal validation by read clustering. Scatter plots between the kallisto|bustools and the starcode workflow show near identical results on the genes targeted by the SwabSeq protocol: (a) RPP30, (b) S, and (c) S spike-in. Each point is a sample and the Pearson correlation is determined for the counts for a gene for all samples between kallisto|bustools and starcode. The code to reproduce this figure is here: https://github.com/pachterlab/BLCSBGLKP_2020/blob/master/notebooks/kb_v_starcode.ipynb.

