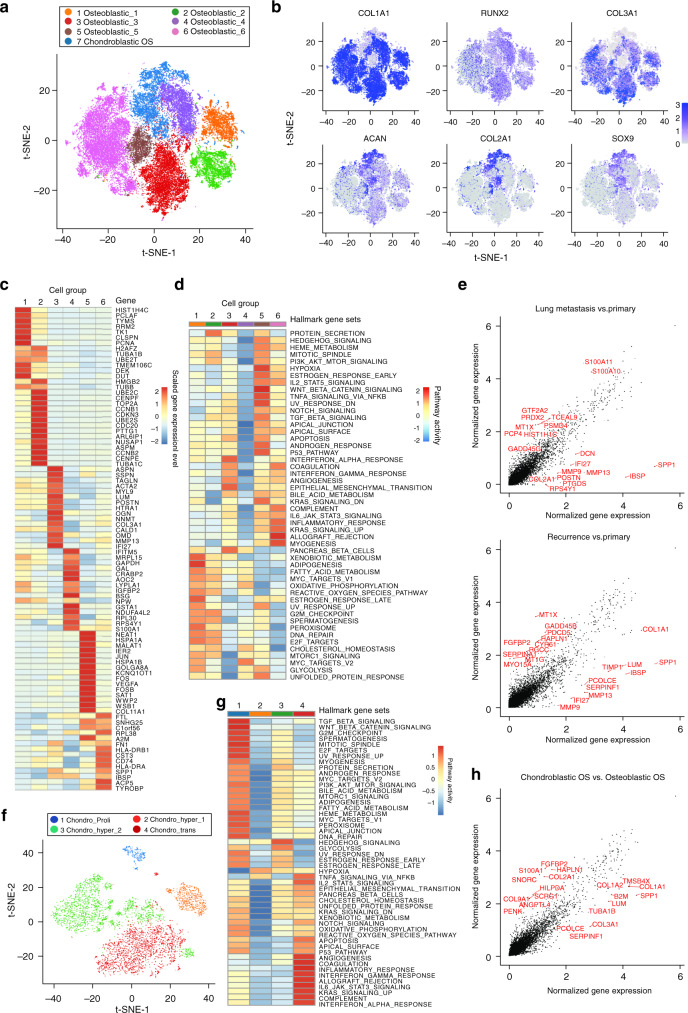
Fig. 2. Distinct clusters of malignant cells in OS lesions.
a Seven main malignant OS cell subclusters were identified by t-SNE analysis. b Feature plots for marker genes of osteoblastic (COL1A1, RUNX2, and COL3A1) and chondroblastic (ACAN, COL2A1 and SOX9) tumor cells. The color legend shows the log1p normalized expression levels of the genes. c The heatmap of the average expression of top 15 DEGs among six subclusters of osteoblastic tumor cells. The color legend indicates normalized gene expression levels among the subclusters. d The heatmap of GSEA of the 50 hallmark gene sets in MSigDB database among the six osteoblastic cell subclusters. e The scatter plot of the DEGs between osteoblastic tumor cells from lung metastasis (upper panel) or recurrent lesion (lower panel) versus primary lesion. The top 10 DEGs in each comparison were labeled in red. f The t-SNE plot of the four subclusters of chondroblastic cells. g The heatmap of GSEA of the 50 hallmark gene sets in MSigDB among the four chondroblastic clusters. h The scatter plot of the DEGs between chondroblastic and osteoblastic malignant cells. The top 10 genes in each subcluster were marked in red. Relative GSEA scores for each gene set across the cell clusters (d, g) and detailing average normalized gene expression (log1p transformed) values in different tumor sites (e) or types (h) are provided in the Source Data file.

