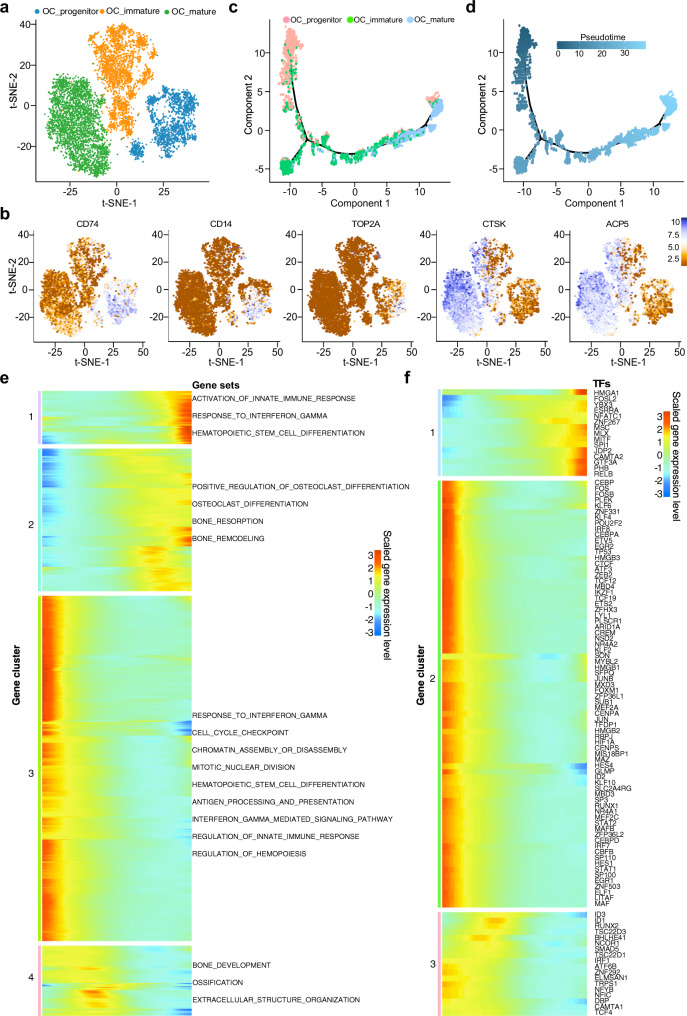
Fig. 4. Trajectory analysis of osteoclast cells (OC) in OS lesions.
a t-SNE plot showing the three main subclusters of osteoclasts. b Feature plots showing the normalized expression levels of myeloid and osteoclast markers CD74, CD14, ACP5, CTSK, and TOP2A in these subclusters. c, d The Monocle 2 trajectory plot showing the dynamics of osteoclast subclusters (c) and their pseudotime curve (d). e The DEGs (in rows, q-value < 10−10) along the pseudotime were hierarchically clustered into four subclusters. The top annotated GO terms in each cluster were provided. f Heatmap hierarchical clustering showing differentially expressed transcription factor genes along with the pseudotime curve in (e).

