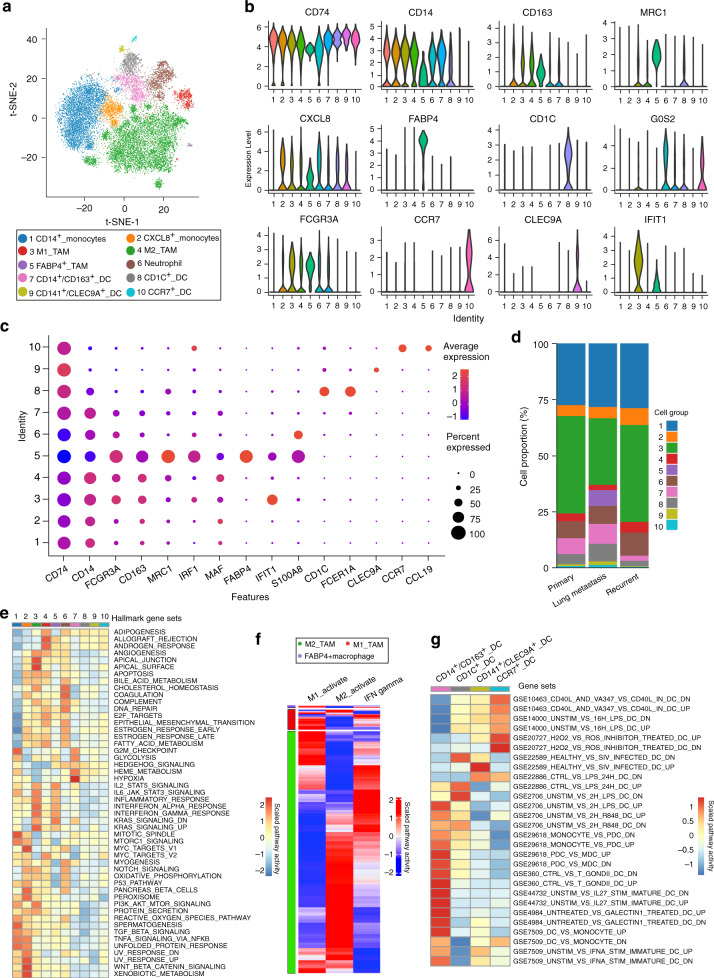
Fig. 6. Comprehensive dissection of myeloid cells in OS lesions.
a t-SNE plot separated 10 subclusters of the myeloid cells in OS lesions. b The violin plots showing the normalized expression levels of signature genes across the myeloid subclusters. c Dot plots showing cluster signature genes in myeloid cells. The size of dots represents the proportion of cells expressing the particular marker, and the spectrum of color indicates the mean expression levels of the markers (log1p transformed). d The proportion of the myeloid cells in the OS lesions with different types of lesions. e The heatmap of GSEA of 50 hallmark gene sets in MSigDB database between the 10 subclusters of myeloid cells. f Heatmap of the gene sets or signaling pathways specific for M1-activation, M2-activation, and IFN-γ activation for the macrophages in OS lesions, based on GSVA enrichment scores. g Heatmap of the gene sets or signaling pathways specific for each of the four subclusters of DC-activation based on GSEA enrichment scores with MSigDB database. The detailed cell proportion values of (d) and the relative GSEA scores for each gene set across the cell clusters of (e, g) are provided in the Source Data file.

