Figure 4.
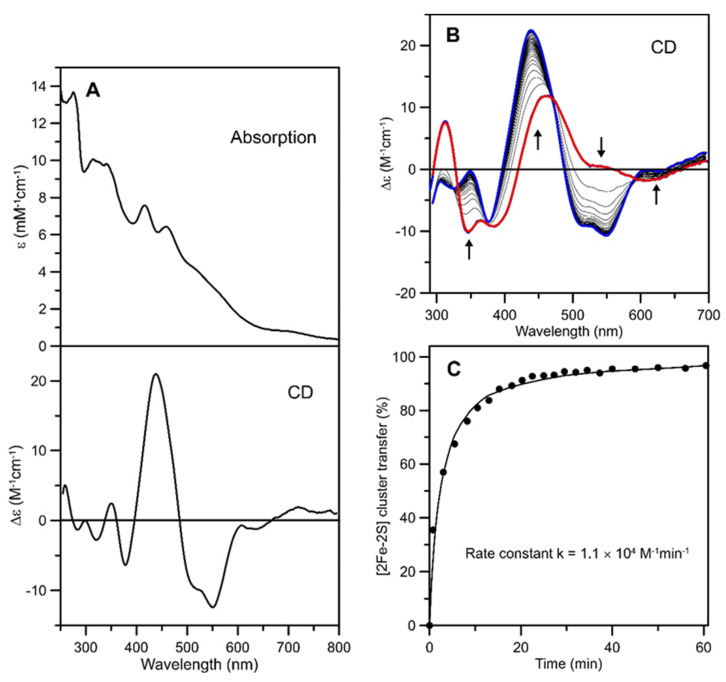
Cluster transfer from At [2Fe-2S]2+-GRXS15 to At apo-mFDX1 monitored by CD spectroscopy as a function of time. (A) Room temperature UV-visible absorption and CD spectra of [2Fe-2S]2+ cluster-bound as-isolated At mFDX1. (B) CD spectra of the cluster transfer reaction mixture that was initially 40 µM in GRXS15 [2Fe-2S]2+ clusters and 40 µM in apo-mFDX1. The thick red line corresponds to [2Fe-2S]2+-GRXS15 recorded before addition of apo-mFDX1. The thin grey lines correspond to CD spectra recorded at 1, 3, 5, 8, 10, 13, 15, 17, 20, 22, 25, 27, 30, 32, 34, 37, 40, 45, 50, 56, 60, 69, 75, 86, 95, 101, 105, 110 and 120 min after the addition of apo-mFDX1. The thick blue line corresponds to complete [2Fe-2S]2+ cluster transfer to mFDX1. The arrows indicate the direction of intensity change with increasing time at selected wavelengths and Δε values were calculated based on the initial concentration of [2Fe-2S]2+ clusters. The cluster transfer reaction was carried out under anaerobic conditions at room temperature in 100 mM Tris-HCl buffer at pH 7.8. (C) Kinetic simulation of cluster transfer from [2Fe-2S]2+-GRXS15 to apo-mFDX1 based on second-order kinetics and the initial concentrations of [2Fe-2S]2+ clusters on [2Fe-2S]2+-GRXS15 and of apo-mFDX1. Percent cluster transfer was assessed by CD intensity at 550 nm (black circles) and simulated with a second-order rate constant of 1.1 × 10⁴ M−1min−1.

