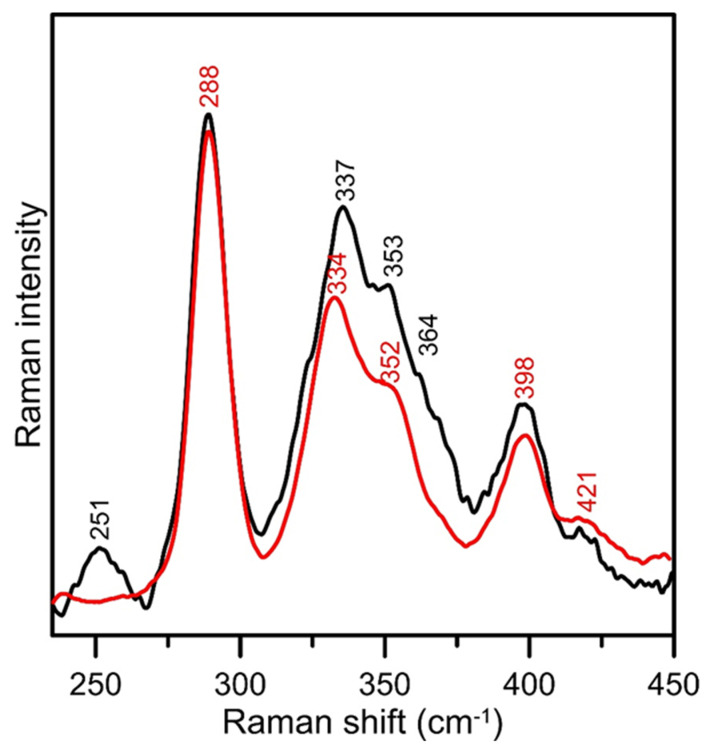
Figure 8.
Comparison of the resonance Raman spectra of [2Fe-2S]2+ cluster-bound as-isolated At ISCA1a/2 (red line) and [4Fe-4S]2+ cluster-bound reconstituted At ISCA1a/2 (black line) using 458-nm laser excitation. The samples (~2 mM [2Fe-2S]2+ or [4Fe-4S]2+ clusters) in 100 mM Tris-HCl buffer at pH 7.8 were in the form of frozen droplets at 17 K. The spectra are the sum of 100 individual scans with each scan involving photon counting for 1 s at 0.5 cm−1 increments with 7 cm−1 spectral resolution. Bands due to lattice modes of the frozen buffer solution have been subtracted from both spectra.

