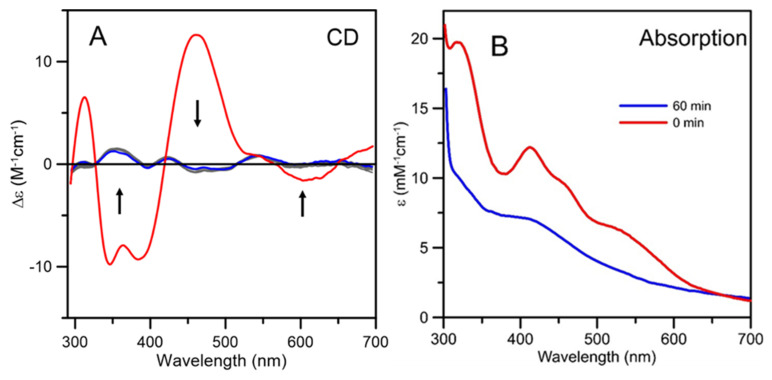
Figure 9.
Cluster transfer from At [2Fe-2S]2+-GRXS15 to At apo-ISCA1a/2 monitored by UV-visible absorption and CD spectroscopy as a function of time. (A) The thick red line is the CD spectrum of [2Fe-2S]2+ cluster-bound GRXS15 before addition of At apo-ISCA1a/2 to the reaction mixture. The thin grey lines are CD spectra of the reaction mixture, GRXS15 (60 μM in [2Fe-2S]2+ clusters) mixed with DTT-pretreated apo-ISCA1a/2 (30 μM) in 100 mM Tris-HCl, pH 7.8, with 1 mM GSH, recorded at 1, 3, 5, 17, 20, 25, 28, 30, and 34 min after addition of apo ISCA1a/2. The thick blue line corresponds to the final CD spectra after 60 min. The arrows indicate the direction of change in CD intensity with time at selected wavelengths and Δε values are based on the initial concentration of [2Fe-2S]2+ clusters in the reaction mixture. (B) The thick red line is the absorption spectrum of [2Fe-2S]2+ cluster-bound GRXS15 before addition of At apo-ISCA1a/2 to the reaction mixture. The thick blue line corresponds to the final absorption spectrum 60 min after addition of At apo-ISCA1a/2 to the reaction mixture. ε values are based on the initial concentration of [2Fe-2S]2+ clusters in the reaction mixture.

