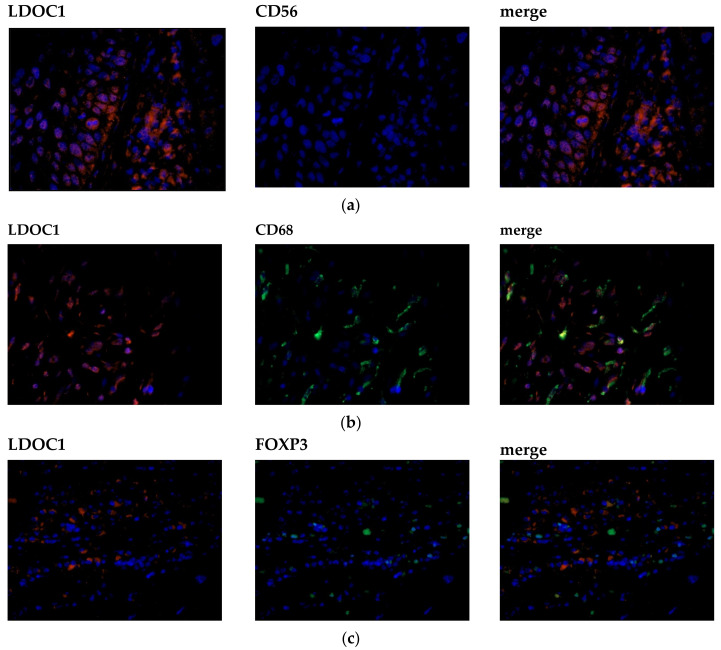
Figure 4.
Characterization of the immune cell subpopulation by immunofluorescence double staining. Cell nuclei were marked by DAPI staining (blue). Left column showing LDOC1-positive cells (red), center column showing positive immune cells (green), right column showing a co-expression of the evaluated immune cell marker (green) and LDOC1 (red). Most infiltrating cells were CD68-positive macrophages, followed by FOXP3-positive regulatory T-cells. Representative photomicrographs are presented (40x magnification): (a) no expression of CD56-positive immune cells; (b) for CD68-positive immune cells (green) a co-expression of LDOC1 (red) could be detected; (c) for FOXP3-positive immune cells (green) a co-expression of LDOC1 (red) could be detected.

