Figure 5.
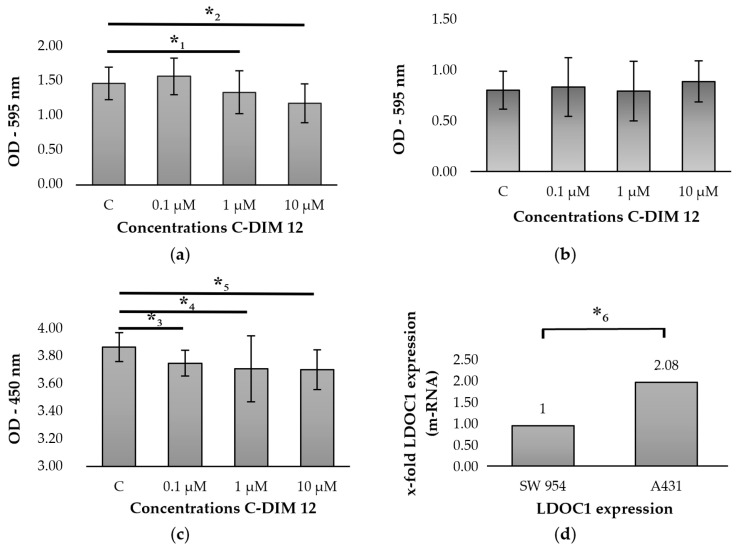
Incubation of cell lines A431 and SW 954 with C-DIM 12: (a) MTT assay of cell line A431: cell viability decreases significantly after 72 h of incubation with C-DIM 12 starting at a concentration of 1 μM compared to the unstimulated control cells. Significant observations according to the Wilcoxon test are highlighted with an asterisk (*1: p = 0.007, *2: p = 0.005); (b) MTT assay of cell line SW 954: no significant influence on cell viability after 72 h of incubation with C-DIM 12 compared to the unstimulated control cells; (c) BrdU assay of cell line A431: cell proliferation decreases significantly with increasing C-DIM 12 concentration after 72 h of incubation. Significant observations according to the Wilcoxon test are highlighted with an asterisk (*3: p = 0.002, *4: p = 0.003, *5: p = 0.002); (d) real-time PCR analysis of cell lines A431 and SW 954. LDOC1 expression was revealed to be twice as high in A431 in contrast to the cell line SW 954. The difference between the two cell lines was found to be statistically significant according to the Wilcoxon test with *6: p = 0.026.

