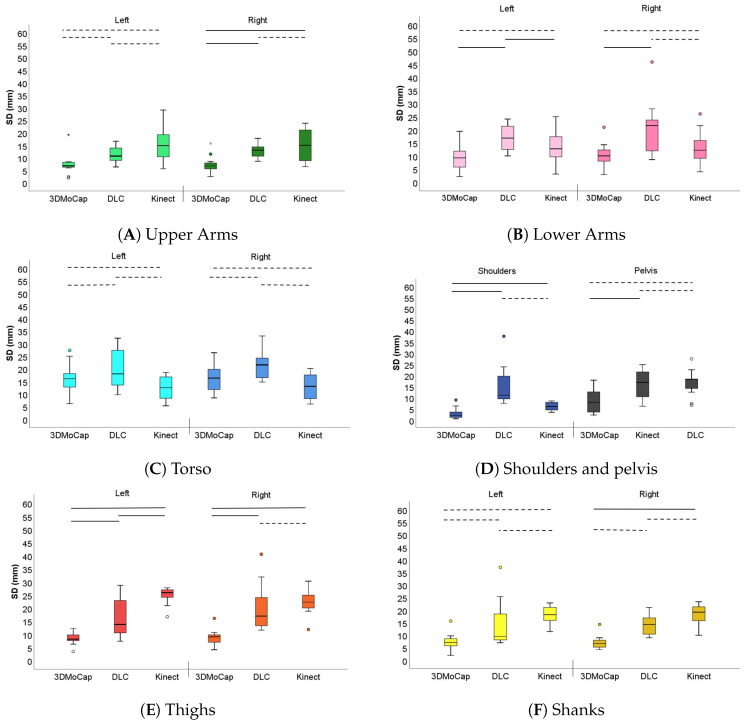
Figure 6.
Box plots of variation of standard deviations of upper arms (A), lower arms (B), torso (C), shoulders and pelvis (D), thighs (E), and shanks (F) for the left and right side of the body. 3DMoCap = 3D motion capture system, DLC = DeepLabCut. Dotted lines signify p > 0.017, solid lines p < 0.017 from Wilcoxons Signed Rank test.

