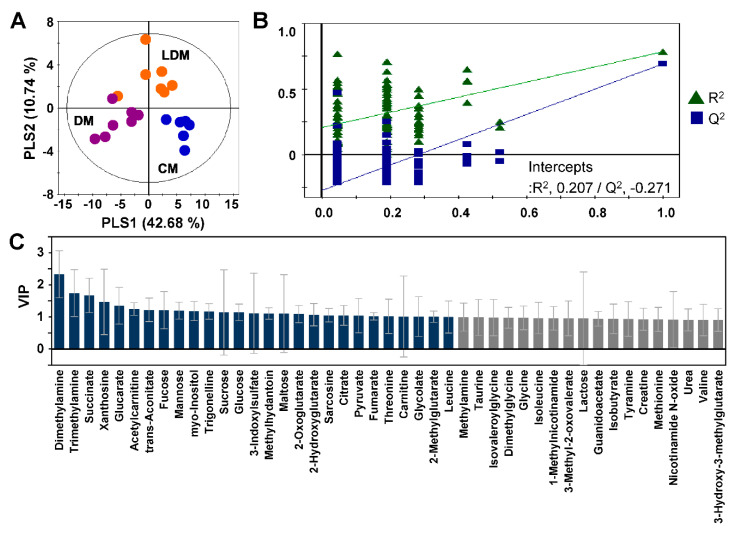
Figure 2.
PLS-DA score plot of targeted metabolic profiles of mouse urine. The PLS-DA score plot (A) shows perturbation of metabolic patterns in CM (blue dots), DM (violet dots), and LDM (orange dots). Validation plots of urine (B) were obtained from 100 permutation tests of the responses to the PLS-DA models. Identified metabolites that have high VIP scores are presented in the bar graph (C) in gray (VIP > 0.9) or dark blue (VIP > 1.0). PLS-DA, partial least squares discriminant analysis, CM, control mice; DM, STZ-induced diabetic mice; LDM, losartan-treated diabetic mice.

