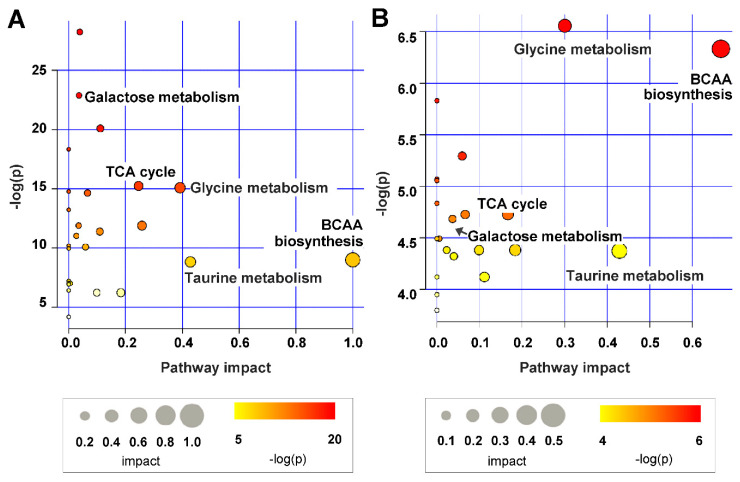
Figure 4.
Summary of the analysis of pathways affected by STZ-induced kidney injury (A) and losartan treatment (B) in urine. The circle size and importance (x-axis) represent the pathway impact value calculated pathway topological analysis, and the circle color and direction (y-axis) is the -log (p-value) obtained from pathway enrichment analysis. The most significant pathways were represented with size and color in the circle from the smallest to the largest and from yellow to red, respectively.

