
Figure 2.
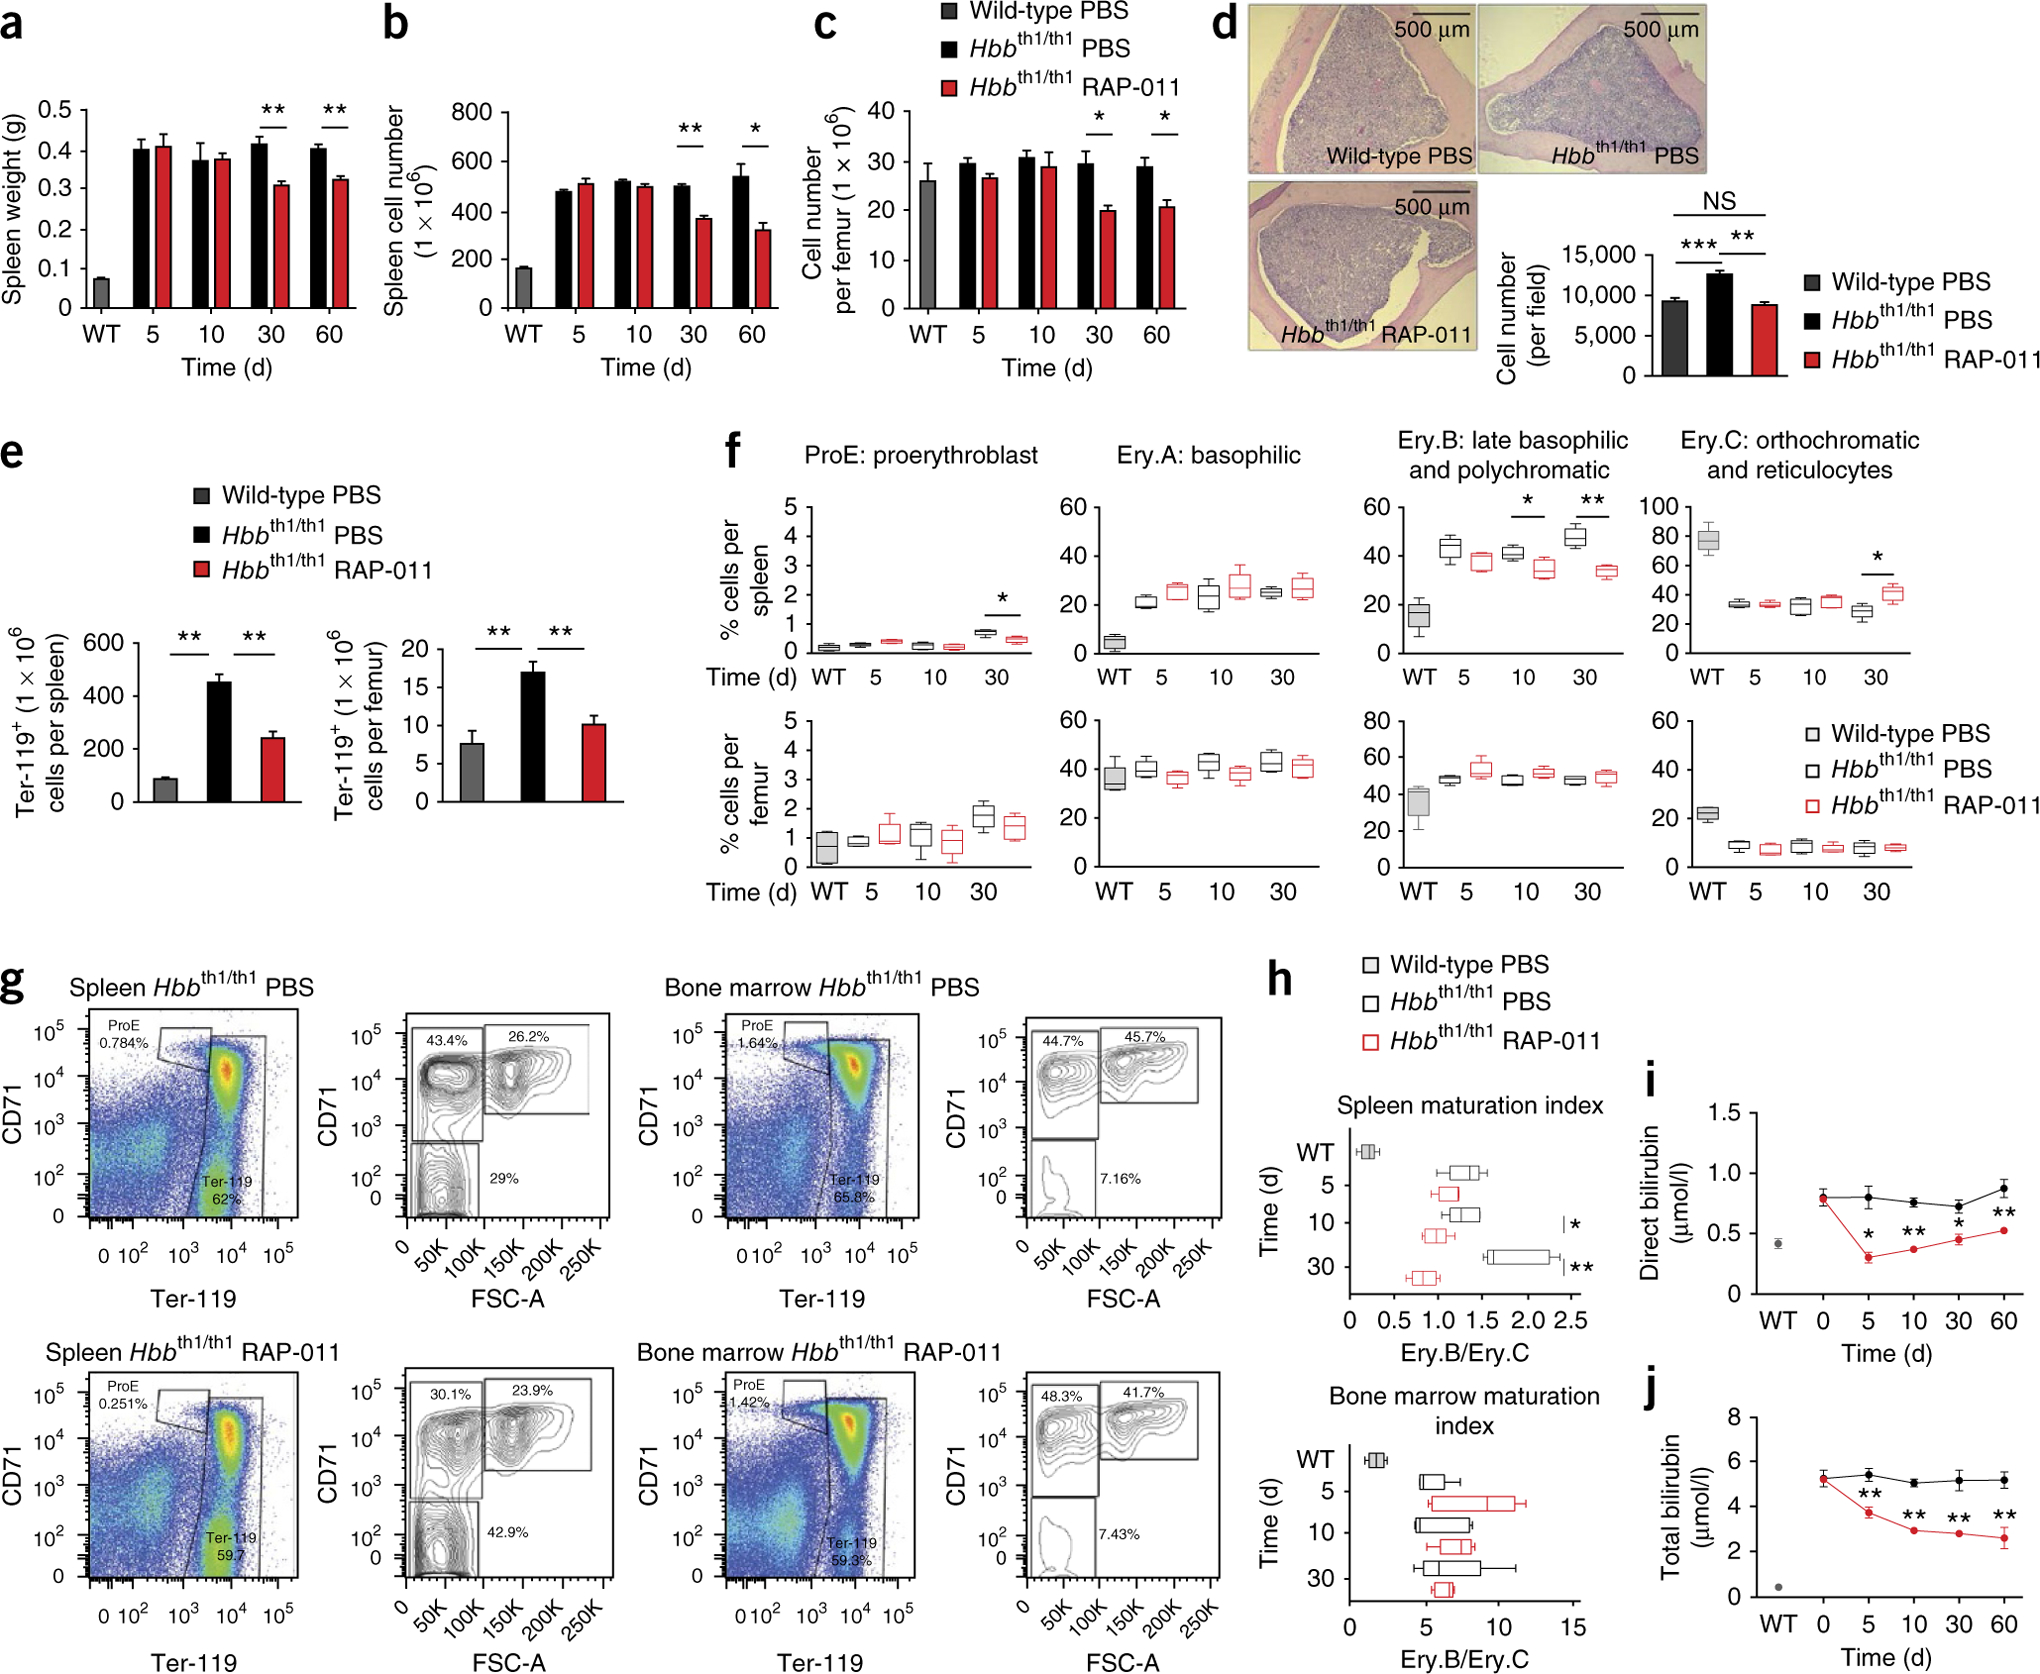
RAP-011 treatment reduces ineffective erythropoiesis in thalassemic mice. (a–c) Spleen weight (a), total spleen cell number (b) and bone marrow cellularity (c) of thalassemic mice treated for 5, 10, 30 or 60 d with RAP-011 or PBS. (d) Bone marrow erythroblast number and distribution observed in H&E-stained cross-sections of bones of RAP-011–treated or PBS-treated thalassemic mice (60 d of treatment). (e) Bone marrow and spleen erythroblast number in RAP-011– or PBS-treated mice (30 d of treatment). (f) Erythroblast differentiation in bone marrow and spleen harvested 5–30 d after treatment with RAP-011 and evaluated by CD71 and Ter-119 staining and forward scatter (FSC) distribution. The percentage of different erythroblast populations is shown. Box-and-whisker plots show means and maximal and minimal values. (g) Representative flow cytometry analysis of spleen and bone marrow erythroblast subset distribution in RAP-011– and PBS-treated thalassemic mice (30 d of treatment). FSC-A, forward scatter area. (h) An index of ineffective erythropoiesis established by calculating the ratio of Ery.B and Ery.C percentage populations. Box-and-whisker plots show means and maximal and minimal values. (i,j). Biochemical analysis of parameters of ineffective erythropoiesis in sera of thalassemic mice treated for up to 60 d with RAP-011 or PBS: direct bilirubin (i) and total bilirubin (j). All data are expressed as the mean ± s.e.m. *P < 0.05, **P < 0.01, ***P < 0.005; n = 5 mice per group for one out of three independent experiments.