
Figure 3.
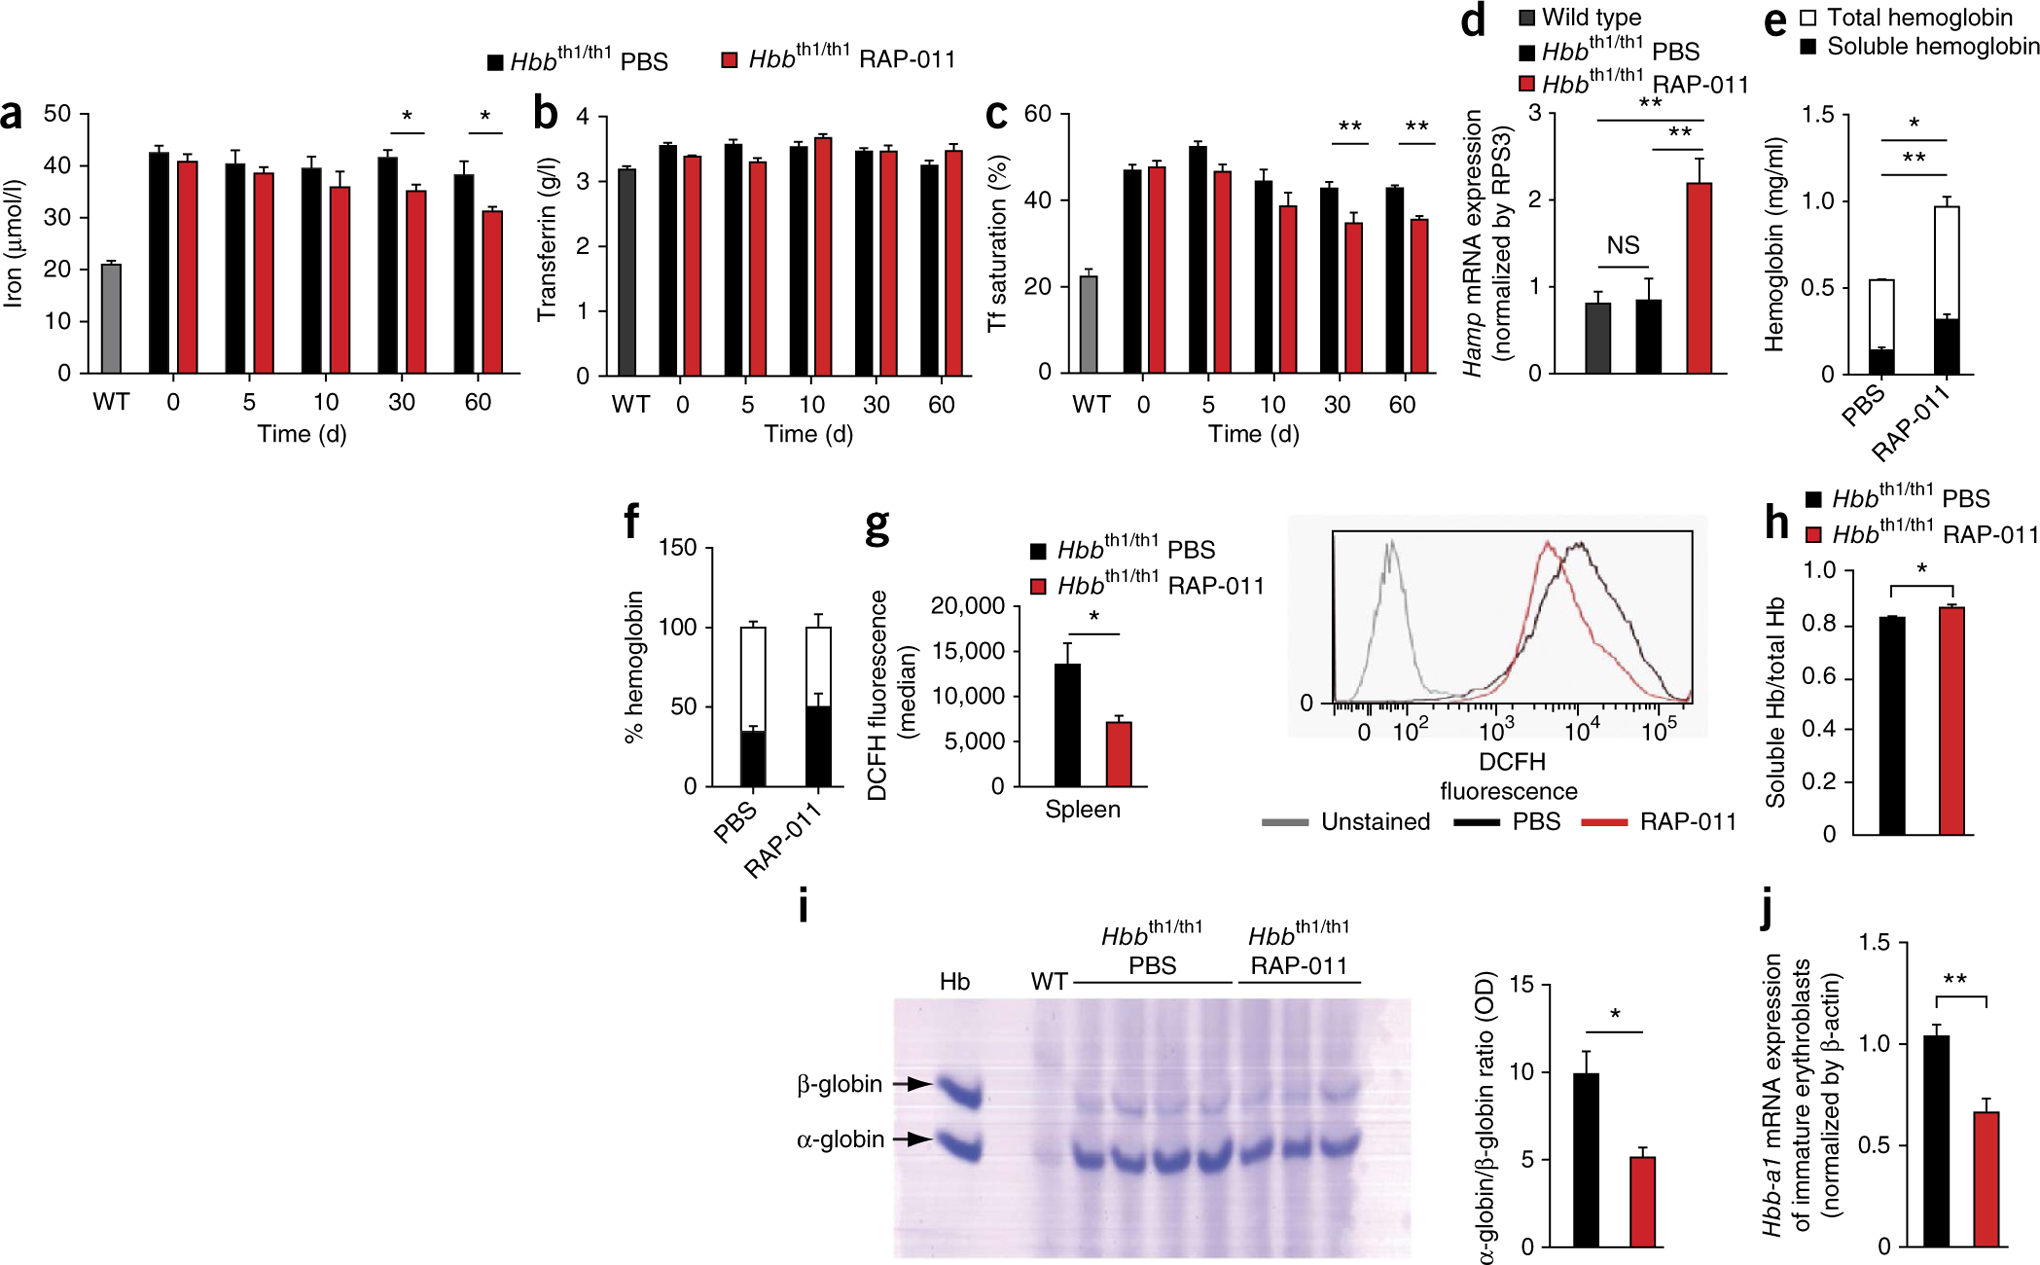
RAP-011 treatment decreases iron overload and RBC-associated hemoglobin precipitates in thalassemic mice. (a–c) Biochemical analysis of serum iron parameters in wild-type and thalassemic mice. Systemic iron levels (a), transferrin levels (b) and transferrin (Tf) saturation (c) in mice treated for 0, 5, 10, 30 or 60 d with RAP-011 or PBS. n = 5 mice per group. (d) Hepcidin (Hamp) mRNA levels measured by quantitative PCR (qPCR) from liver samples of wild-type or thalassemic mice treated with PBS or RAP-011. NS, not significant. n = 5 mice per group. (e–i) Effects of RAP-011 on globin chain expression and membrane α-globin precipitation. Total hemoglobin (e) and soluble hemoglobin (f) levels in primary thalassemic erythroblasts treated for 48 h with 10 μg/ml RAP-011 or PBS, as assayed by Drabkin’s method. n = 3 mice per group. (g) Left, ROS generation evaluated by flow cytometry using dichlorodihydrofluorescein (DCFH) in primary erythroblasts treated with RAP-011 or PBS for 48 h. Right, a representative FACS histogram for DCFH fluorescence. Gray line indicates unstained control cells, and black and red lines represent PBS- and RAP-011–treated erythroblasts, respectively. n = 6 mice per group. (h) Determination of total and soluble hemoglobin by Drabkin’s method in blood hemolysates from thalassemic mice treated with PBS or RAP-011 for 30 d (4 out of 5 animals for each group). (i) Left, triton–acetic acid–urea (TAU) gel electrophoresis of blood collected from wild-type and thalassemic mice treated with PBS (4 out of 5 animals) or RAP-011 (3 out of 5 animals) for 30 d, as indicated. Arrows indicate α-globin and β-globin staining from RBC membranes. Right, quantification of the optical density (OD) of the gel bands, expressed as the α-globin to β-globin ratio to hemoglobin (total lysate). (j) Expression of Hbb-a1 adult globin mRNA evaluated by qPCR, in purified immature (CD71+) erythroblasts from wild-type and thalassemic mice treated with PBS or RAP-011 for 30 d (4 out of 5 animals for each group). All data are expressed as the mean ± s.e.m. *P < 0.05 and **P < 0.01 for one out of three independent experiments.