Figure 4.
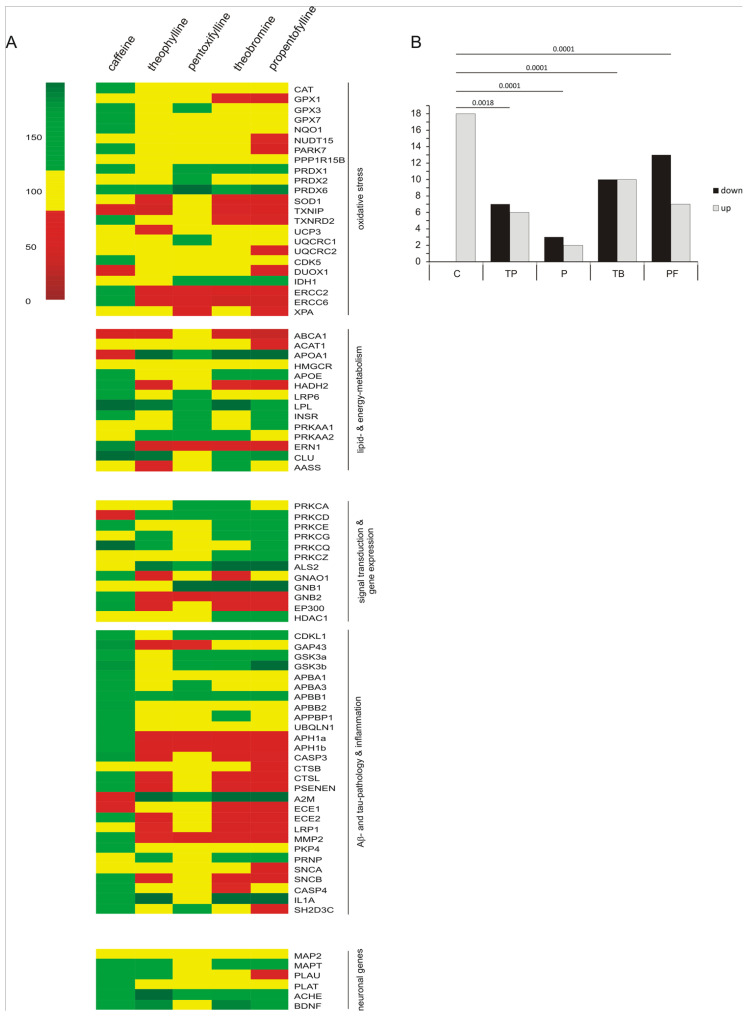
Transcriptional influence of caffeine, theobromine, theophylline, pentoxifylline and propentofylline in SH-SY5Y cells. (A) Transcriptional changes of genes related to the different pathways involved in oxidative stress, lipid and energy metabolism, signal transduction and gene expression, and Aβ- and tau-pathology and inflammation after treatment of human neuroblastoma cells (SH-SY5Y) for 24 h with 100 µM of the analyzed xanthine derivatives, in comparison to the solvent control, are illustrated in a heatmap. Fold changes greater than the standard deviation (yellow) are highlighted in red when downregulated and in green when upregulated. (B) The number of genes which are significantly changed by a single methylxanthine are summarized in a bar diagram. To calculate the significance of the observed effects we first performed an ANOVA for each gene to examine if there are differences in general. Afterwards, these p-values were adjusted with the false discovery rate method over all 83 analyzed genes. To determine which methylxanthine significantly changed the expression of a gene compared to the solvent control, we performed Dunnett’s test. To examine if there are significant differences in the distribution patterns of the significantly down- or upregulated genes influenced by the analyzed methylxanthines, we performed Fisher’s exact test.

