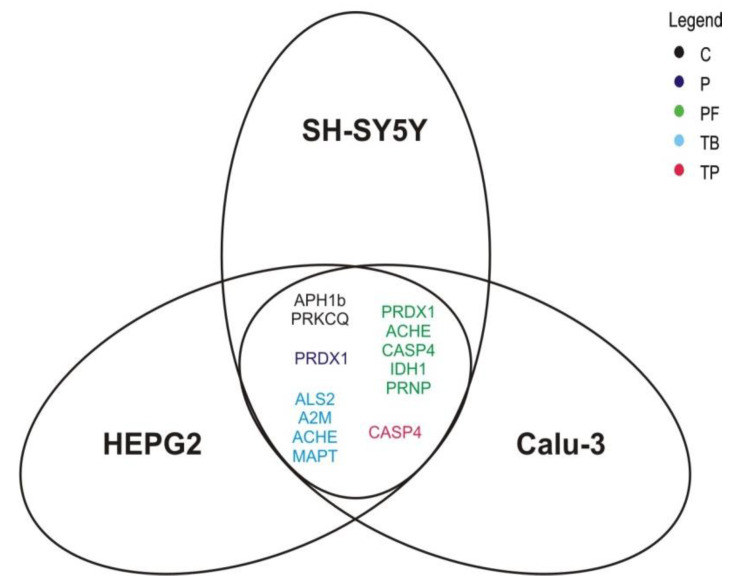
Figure 6.
Analysis of methylxanthine-mediated transcriptional effects, independent of cell type. The Venn diagram illustrates the genes of which the expressional changes, mediated by the analyzed methylxanthines (shown in different colors), are conserved over the three cell lines SH-SY5Y, HEPG2 and Calu-3. C: caffeine, TB: theobromine, TP: theophylline, P: pentoxifylline, PF: propentofylline.

