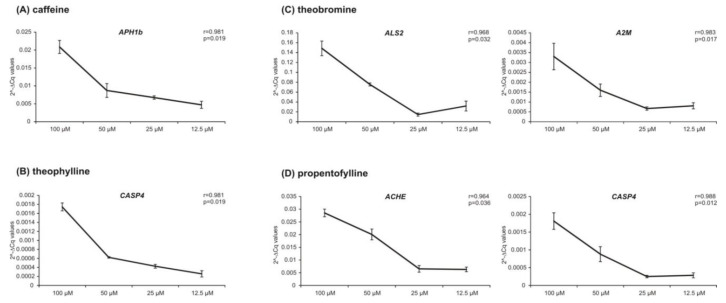
Figure 7.
Analysis of dose-dependent effects of methylxanthines. The expression of APH1b, ALS2, A2M, CASP4, ACHE and CASP4 are plotted against the concentrations of caffeine (A), theophylline (B), theobromine (C) and propentofylline (D) in diagrams, respectively. The Pearson correlation coefficient r and the corresponding p-value are shown for each gene.

