Figure 3.
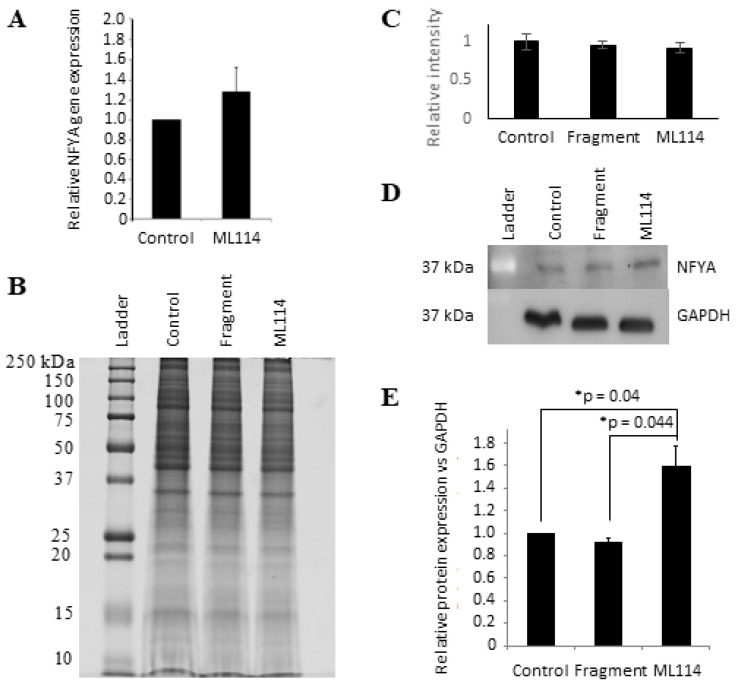
NFYA protein expression is significantly increased in ML114-treated hPSCs. (A) Real-time PCR data showing no significant increase in NFYA transcript expression caused by 100 μM ML114 (p = 0.39). (B,C) Image of a Coomassie blue-stained SDS-PAGE gel (B) and quantification of whole-lane protein staining (C) show similar gross-protein expression patterns in hPSCs treated with: Control (DMSO-only); 100 μM ML114 fragment (“Fragment”); and 100 μM ML114 (“ML114”). (D,E) Western blot (D) and associated densitometry quantification (E) showing a significant increase in NFYA protein levels in ML114-treated hPSCs compared to the control treatments (n = 3 for all treatments).

