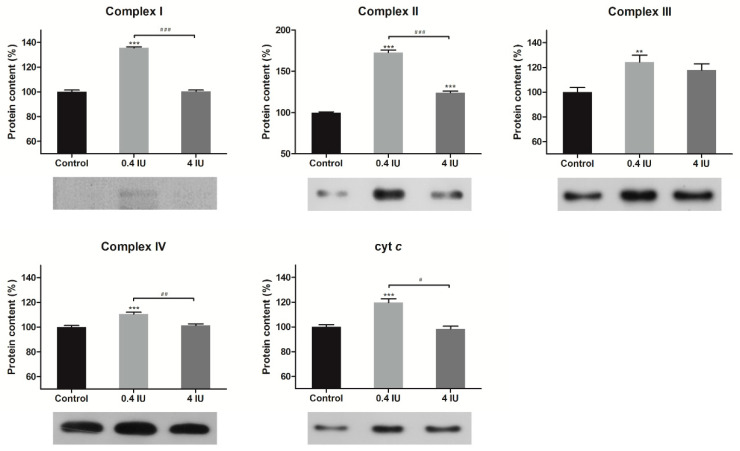
Figure 2.
Effects of acute insulin treatment on the expression of electron transport chain (ETC) complexes and cyt c in mitochondria-enriched fractions (MEF). Protein content is expressed relative to controls, which were standardized to 100%. Mean ± SEM values are averages of three independent experiments performed in triplicate (pooled from six animals in each group). A representative blot is shown. Volume is the sum of all pixel intensities within a band (1 pixel = 0.007744 mm2). * compared to control: ** p ≤ 0.01, *** p ≤ 0.001; # 0.4 IU vs. 4 IU: # p ≤ 0.05, ## p ≤ 0.01, ### p ≤ 0.001.

