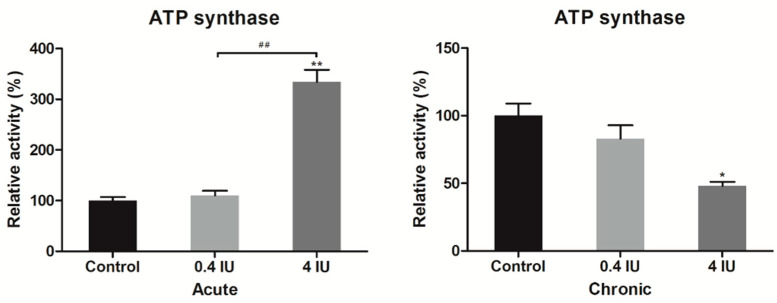
Figure 8.
Relative ATP synthase activity following acute and chronic insulin treatment. Data showing ATP synthase activity, expressed relative to a control (taken as 100%), represent the means ± SEM values of three independent experiments. * compared to control: * p ≤ 0.05, ** p ≤ 0.01; # 0.4 IU vs. 4 IU: ## p ≤ 0.01.

