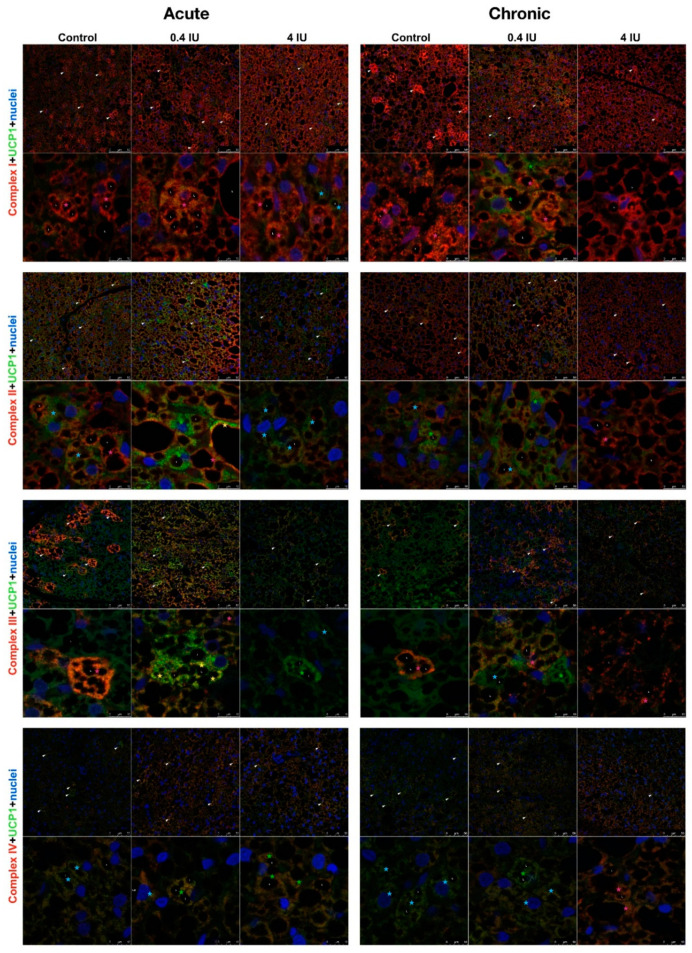
Figure 9.
Immunofluorescence of UCP1 and ETC complexes in BAT following acute and chronic insulin treatment. Double labeling with antibodies against UCP1 (green) and ETC complexes (red). Harlequin effect is shown with arrowheads. BAT showed various brown adipocytes with different degree of immunoexpression: UCP1-only brown adipocytes (light-blue star); UCP1 predominantly positive brown adipocytes (green star); brown adipocytes with clear colocalization of UCP1 and specific ETC complex (yellow star); specific ETC complex predominantly positive brown adipocytes (pink star); and specific ETC complex-only brown adipocytes (red star). L—lipid bodies. Nuclei were stained with Sytox Orange. Scale bar = 50 µm (first row) and 10 µm (second row).

