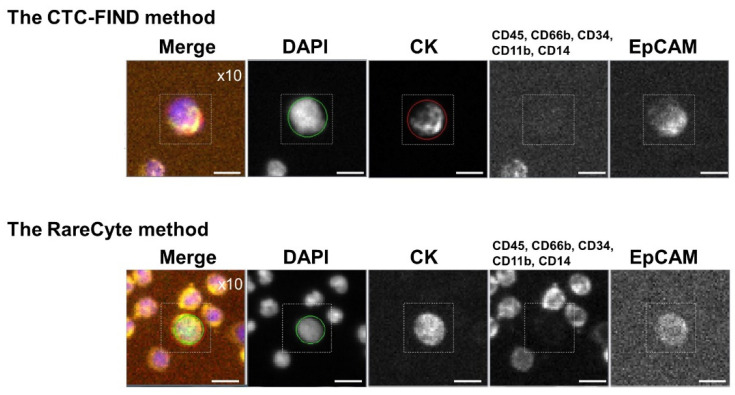
Figure 1.
Representative images of circulating tumor cells (CTCs) collected by each method. Representative immunofluorescence images of CTCs detected by the slit filter-based CTC isolation unit of CTC-FIND and the CyteFinder® system (the CTC-FIND method), and the AccuCyte®-CyteFinder® system (the RareCyte method). CTCs were defined as cells with positive staining for cytokeratin (CK) and/or epithelial cell adhesion molecule (EpCAM), but negative for cluster of designation 45 (CD45), CD66b, CD34, CD11b, and CD14. The 4′,6-diamidino-2-phenylindole (DAPI) staining shows the presence of cells. The scale bars indicate 10 μm. Cells were scanned at a magnification of 10×. The excitation (Ex) and emission (Em) wavelengths for each biomarker were as follows: DAPI, Ex 390 nm, Em 431 nm; CK, Ex 475 nm, Em 525 nm; CD45, CD66b, CD34, CD11b, and CD14, Ex 542 nm, Em 590 nm; and EpCAM, Ex 632 nm, Em 690 nm.

