Figure 2.
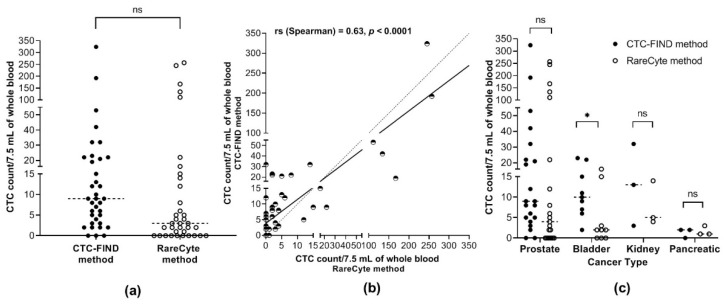
CTC enumeration. (a) The CTC counts in 7.5 mL of whole blood by each method. The CTC counts from each whole blood sample by the CTC-FIND method and the RareCyte method are indicated as ● (filled circles) and ○ (open circles), respectively. The CTC counts from 36 blood samples are shown. The median CTC count in 7.5 mL of whole blood was 9.0 and 3.0 for the CTC-FIND method and the RareCyte method, respectively (Wilcoxon matched-pairs signed-rank test, p = 0.0896). (b) Correlation in the total CTC counts between the two methods. The correlation analysis is shown by plotting the CTC counts in 7.5 mL of whole blood by the CTC-FIND method and the RareCyte method on the Y- and X-axes, respectively. These points are indicated as the half-empty circles. The correlation between the total CTC counts obtained by the CTC-FIND method and the RareCyte method was significant (Spearman’s rank correlation coefficient, rs = 0.63, p < 0.0001). An identity line is shown as a dashed line. Simple linear regression is shown as a solid line. (c) Each method was used to determine the CTC counts in 7.5 mL of whole blood in four different types of cancers. The CTC counts from each sample by the CTC-FIND method and the RareCyte method are indicated as ● (filled circles) and ○ (open circles), respectively. Wilcoxon matched-pairs signed-rank test was used. *: p < 0.05; ns: not significant.

