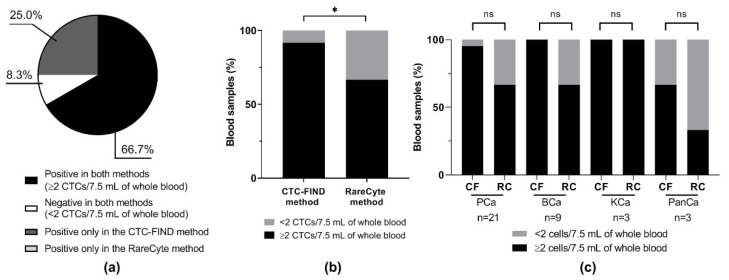
Figure 3.
CTC positive rate. (a) Concordance between the two methods for the identification of CTC-positive and -negative samples. CTC-positive samples were defined as those with ≥2 CTCs/7.5 mL of blood. (b) The percentage of CTC-positive samples among all samples as assessed by the two methods. In this bar chart, black shading indicates the percentage of CTC-positive samples (out of 36 in total). The percentage of CTC-positive samples was 91.7% with the CTC-FIND method and 66.7% with the RareCyte method; they differed significantly (p = 0.0182 by Fisher’s exact test). (c) Frequencies of CTC-positive status for each cancer type. In this bar chart, black shading indicates the percentage of CTC-positive samples (defined as in (a)). CF: the CTC-FIND method; RC: the RareCyte method; PCa: prostate cancer; BCa: bladder cancer; KCa: kidney cancer; PanCa: pancreatic cancer; ns: not significant (p > 0.05 by Fisher’s exact test); *: p < 0.05.

