Figure 4.
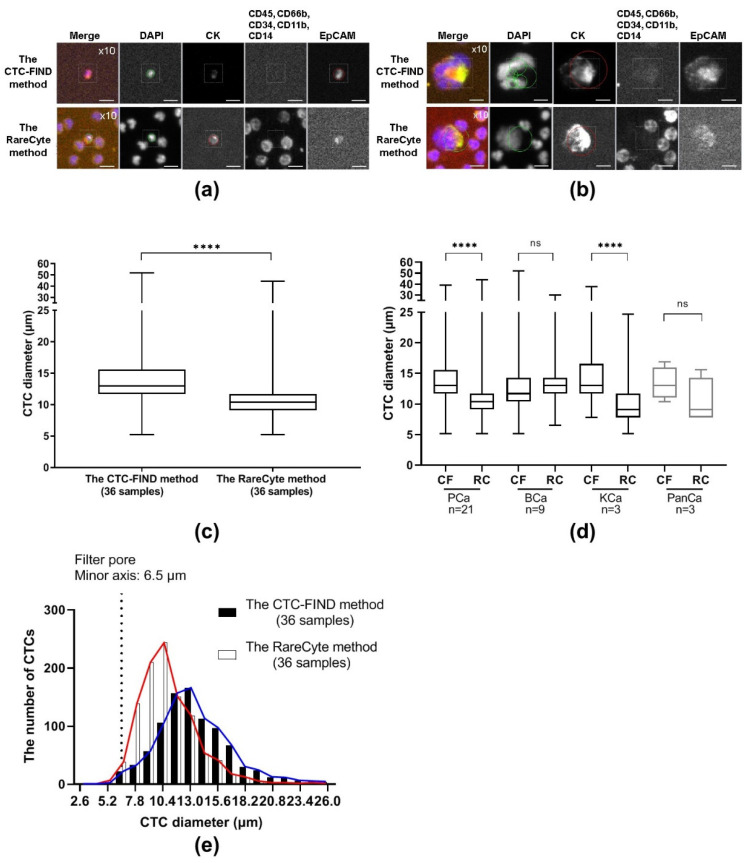
CTC diameter analysis. Representative immunofluorescence images of (a) small CTCs and (b) large CTCs detected by the CTC-FIND method and the RareCyte method. The scale bars indicate 10 μm. Cells were scanned at a magnification of 10×. Each staining image in a given row was taken from the same field of cells. (c) The diameters of each CTC were plotted as a box plot based on the median, interquartile ranges, and maximum and minimum whiskers for each method. The median CTC diameters obtained by the two methods were significantly different (13.0 µm for the CTC-FIND method and 10.4 µm for the RareCyte method; p < 0.0001 by Mann Whitney test). (d) The diameters of CTC in each cancer type were plotted as a box plot based on the median, interquartile ranges, and maximum and minimum whiskers for each method. (e) The CTC diameter distribution and the number of CTCs in each range from each of the two methods. The black and white bars indicate the CTCs obtained by the CTC-FIND method and the RareCyte method, respectively. The X-axis indicates the cell diameter classifications. The graph shows an X-axis with 2.6-μm intervals, i.e., the bar graph between 5.2 µm and 7.8 µm on the X-axis is at 6.5 µm. Blue and red lines indicate a connecting line of the CTC-FIND method and the RareCyte method, respectively. CF: the CTC-FIND method; RC: the RareCyte method; PCa: prostate cancer; BCa: bladder cancer; KCa: kidney cancer; PanCa: pancreatic cancer; ns: not significant (p > 0.05 by Mann Whitney test); ****: p < 0.0001

