Figure 1.
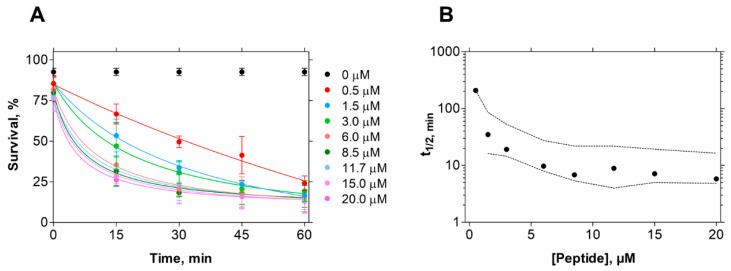
E. coli cell viability kinetics after EcDBS1R4 treatment. (A) Bacteria cell viability followed for 1 h by flow cytometry as a function of peptide concentration. (B) Time kinetics of cell viability after peptide treatment. Each point represents the time necessary to produce 50% of death for each concentration tested. Dashed lines indicate 95% confidence intervals.

