Figure 2.
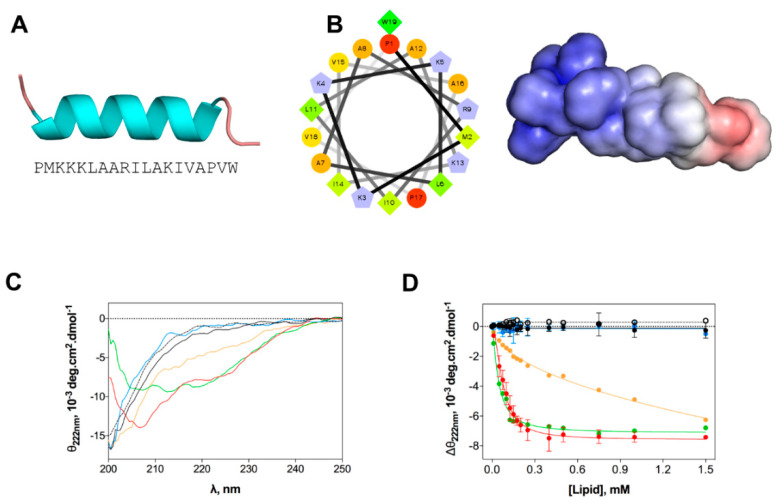
In silico and experimental structural studies of EcDBS1R4 structure. (A) Amino acid sequence of EcDBS1R4 and theoretical three-dimensional structure predicted by homology and constructed using Modeller v. 9.12. (B) α-helical wheel (constructed using the server http://rzlab.ucr.edu/scripts/wheel/wheel.cgi; hydrophobic residues are represented as green diamonds, hydrophilic, non-charged residues are coded as orange circles, and positively charged residues are blue-grey pentagons) and adaptive Poisson-Boltzmann solver electrostatic potential of EcDBS1R4, ranging from −5.0 kBT/e (red) to +5.0 kBT/e (blue). (C,D) Experimental structural studies of EcDBS1R4 in the presence of different LUV compositions. (C) Circular dichroism spectra of EcDBS1R4 in solution (dotted black) at 16 µM, and in the presence of 500 µM of lipid vesicles of POPC (black), POPC:Chol (70:30) (blue), POPC:POPG (70:30) (red), inner (green) and outer (orange) membrane of E. coli mimetic systems. (D) Comparative plot of the θ signal at 222 nm (a local minimum for α-helices) at different lipid concentrations, with the same lipid composition described above. Solid lines represent fits to the experimental data using Equation (1). Each experiment was conducted in triplicate and represented as mean ± standard deviation (SD). Calculated parameters are presented in Table 2.

